Immigrants from Sweden vs Tongan Per Capita Income
COMPARE
Immigrants from Sweden
Tongan
Per Capita Income
Per Capita Income Comparison
Immigrants from Sweden
Tongans
$55,582
PER CAPITA INCOME
100.0/ 100
METRIC RATING
12th/ 347
METRIC RANK
$41,693
PER CAPITA INCOME
9.9/ 100
METRIC RATING
216th/ 347
METRIC RANK
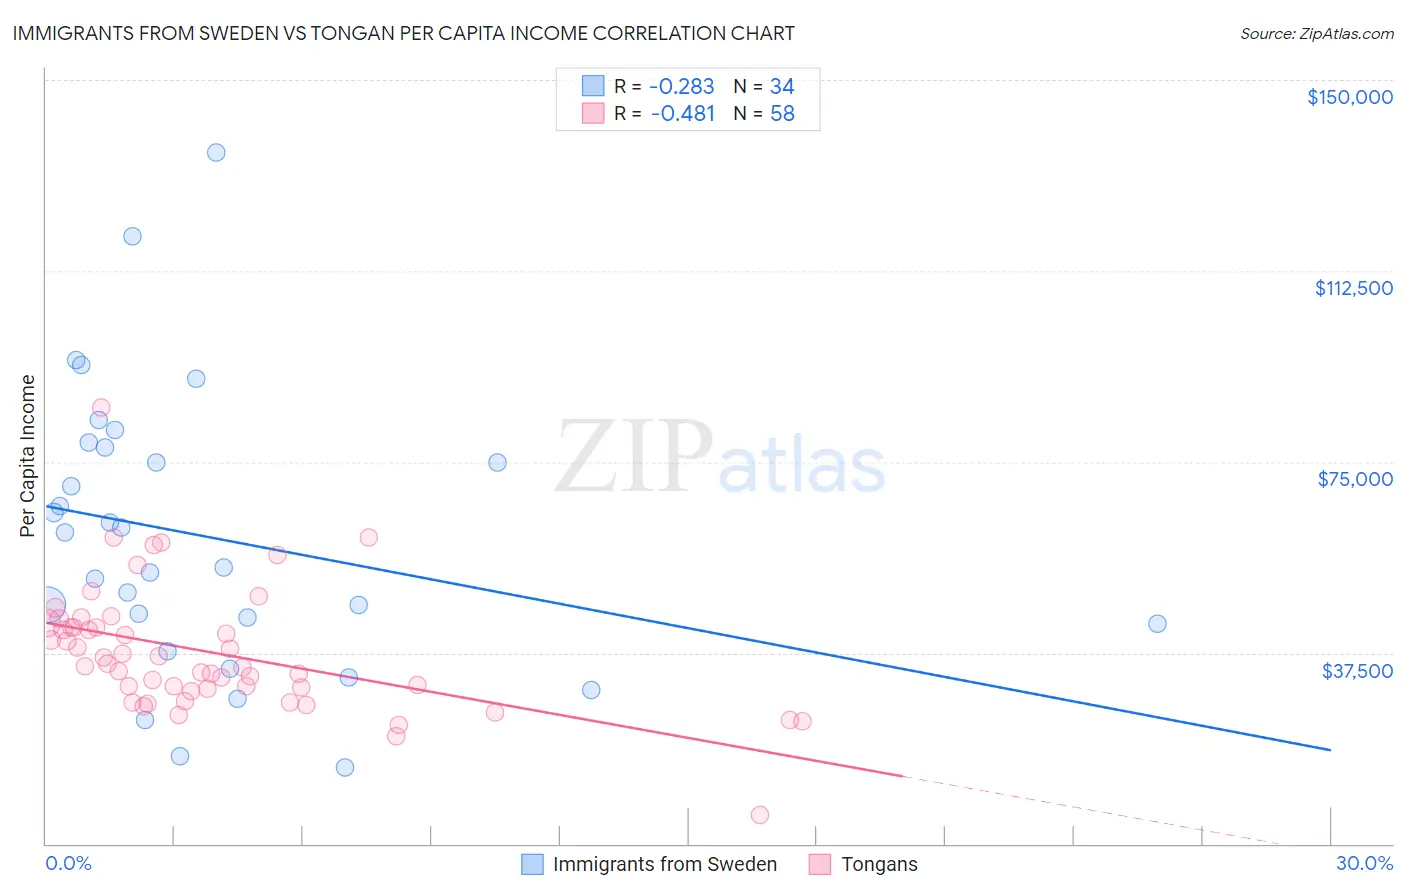
Immigrants from Sweden vs Tongan Per Capita Income Correlation Chart
The statistical analysis conducted on geographies consisting of 164,749,853 people shows a weak negative correlation between the proportion of Immigrants from Sweden and per capita income in the United States with a correlation coefficient (R) of -0.283 and weighted average of $55,582. Similarly, the statistical analysis conducted on geographies consisting of 102,908,385 people shows a moderate negative correlation between the proportion of Tongans and per capita income in the United States with a correlation coefficient (R) of -0.481 and weighted average of $41,693, a difference of 33.3%.
Per Capita Income Correlation Summary
| Measurement | Immigrants from Sweden | Tongan |
| Minimum | $15,015 | $5,622 |
| Maximum | $135,828 | $85,704 |
| Range | $120,813 | $80,082 |
| Mean | $60,294 | $37,644 |
| Median | $57,777 | $35,100 |
| Interquartile 25% (IQ1) | $43,188 | $30,397 |
| Interquartile 75% (IQ3) | $77,916 | $42,507 |
| Interquartile Range (IQR) | $34,728 | $12,110 |
| Standard Deviation (Sample) | $27,626 | $12,429 |
| Standard Deviation (Population) | $27,217 | $12,321 |
Similar Demographics by Per Capita Income
Demographics Similar to Immigrants from Sweden by Per Capita Income
In terms of per capita income, the demographic groups most similar to Immigrants from Sweden are Eastern European ($55,780, a difference of 0.36%), Okinawan ($55,817, a difference of 0.42%), Immigrants from India ($55,268, a difference of 0.57%), Immigrants from Belgium ($55,082, a difference of 0.91%), and Cypriot ($54,899, a difference of 1.2%).
| Demographics | Rating | Rank | Per Capita Income |
| Immigrants | Iran | 100.0 /100 | #5 | Exceptional $57,759 |
| Immigrants | Taiwan | 100.0 /100 | #6 | Exceptional $57,742 |
| Immigrants | Israel | 100.0 /100 | #7 | Exceptional $57,384 |
| Immigrants | Hong Kong | 100.0 /100 | #8 | Exceptional $56,709 |
| Immigrants | Ireland | 100.0 /100 | #9 | Exceptional $56,584 |
| Okinawans | 100.0 /100 | #10 | Exceptional $55,817 |
| Eastern Europeans | 100.0 /100 | #11 | Exceptional $55,780 |
| Immigrants | Sweden | 100.0 /100 | #12 | Exceptional $55,582 |
| Immigrants | India | 100.0 /100 | #13 | Exceptional $55,268 |
| Immigrants | Belgium | 100.0 /100 | #14 | Exceptional $55,082 |
| Cypriots | 100.0 /100 | #15 | Exceptional $54,899 |
| Immigrants | Switzerland | 100.0 /100 | #16 | Exceptional $54,866 |
| Immigrants | France | 100.0 /100 | #17 | Exceptional $54,557 |
| Thais | 100.0 /100 | #18 | Exceptional $54,307 |
| Immigrants | China | 100.0 /100 | #19 | Exceptional $54,264 |
Demographics Similar to Tongans by Per Capita Income
In terms of per capita income, the demographic groups most similar to Tongans are Sudanese ($41,695, a difference of 0.010%), Guamanian/Chamorro ($41,678, a difference of 0.030%), Immigrants from Bangladesh ($41,709, a difference of 0.040%), Immigrants from Venezuela ($41,727, a difference of 0.080%), and Trinidadian and Tobagonian ($41,655, a difference of 0.090%).
| Demographics | Rating | Rank | Per Capita Income |
| Immigrants | Sudan | 13.2 /100 | #209 | Poor $41,986 |
| Ecuadorians | 12.9 /100 | #210 | Poor $41,958 |
| Immigrants | Panama | 11.6 /100 | #211 | Poor $41,853 |
| Immigrants | Senegal | 11.3 /100 | #212 | Poor $41,830 |
| Immigrants | Venezuela | 10.2 /100 | #213 | Poor $41,727 |
| Immigrants | Bangladesh | 10.1 /100 | #214 | Poor $41,709 |
| Sudanese | 9.9 /100 | #215 | Tragic $41,695 |
| Tongans | 9.9 /100 | #216 | Tragic $41,693 |
| Guamanians/Chamorros | 9.7 /100 | #217 | Tragic $41,678 |
| Trinidadians and Tobagonians | 9.5 /100 | #218 | Tragic $41,655 |
| Puget Sound Salish | 8.1 /100 | #219 | Tragic $41,495 |
| Immigrants | Barbados | 7.9 /100 | #220 | Tragic $41,478 |
| Immigrants | Trinidad and Tobago | 7.9 /100 | #221 | Tragic $41,476 |
| Immigrants | Iraq | 7.1 /100 | #222 | Tragic $41,365 |
| Immigrants | Cameroon | 6.8 /100 | #223 | Tragic $41,334 |