Immigrants from Sweden vs Ugandan Hearing Disability
COMPARE
Immigrants from Sweden
Ugandan
Hearing Disability
Hearing Disability Comparison
Immigrants from Sweden
Ugandans
3.0%
HEARING DISABILITY
42.4/ 100
METRIC RATING
180th/ 347
METRIC RANK
2.9%
HEARING DISABILITY
85.5/ 100
METRIC RATING
134th/ 347
METRIC RANK
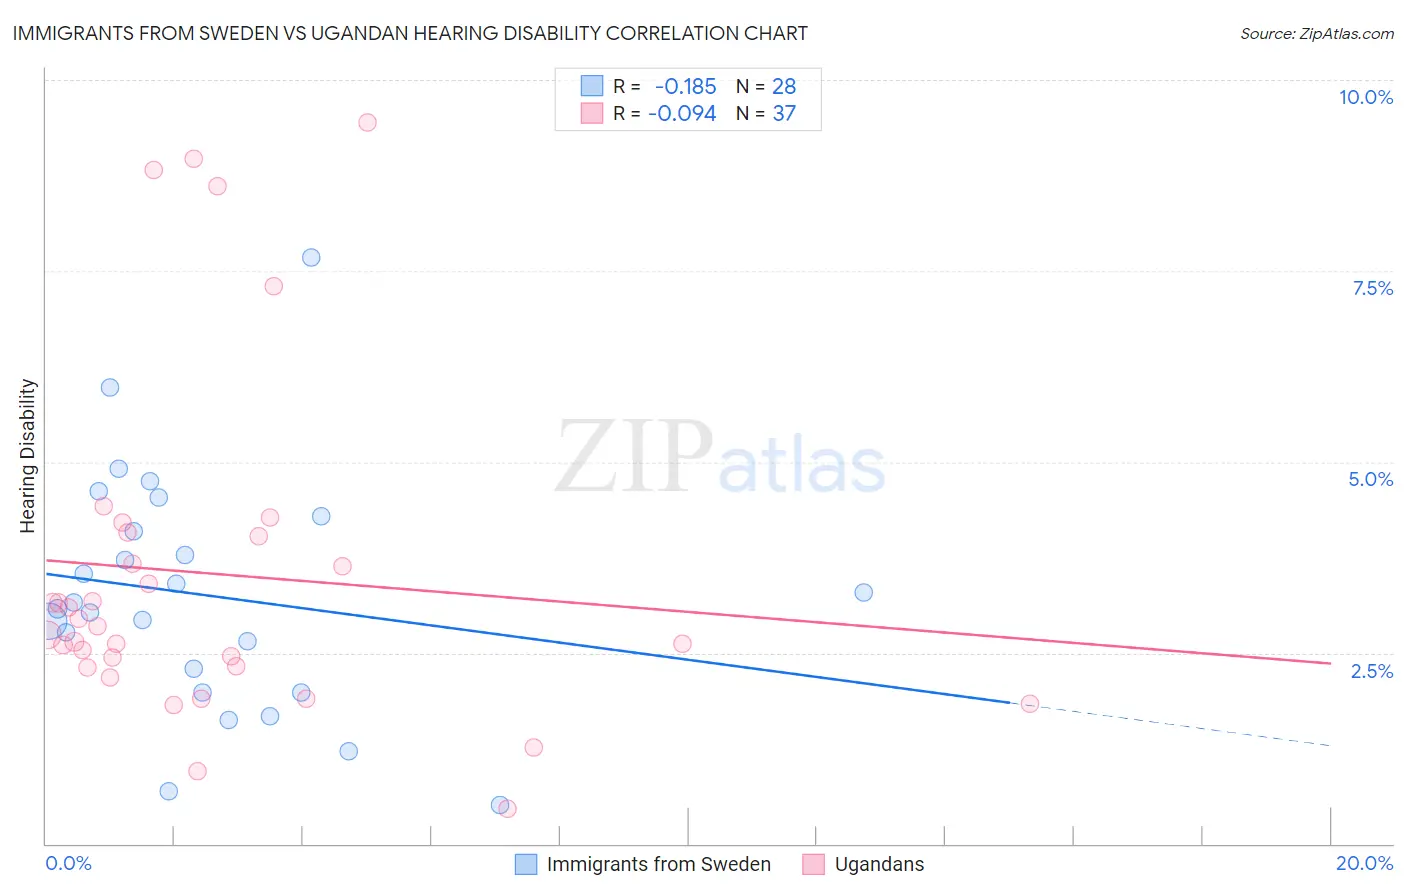
Immigrants from Sweden vs Ugandan Hearing Disability Correlation Chart
The statistical analysis conducted on geographies consisting of 164,738,655 people shows a poor negative correlation between the proportion of Immigrants from Sweden and percentage of population with hearing disability in the United States with a correlation coefficient (R) of -0.185 and weighted average of 3.0%. Similarly, the statistical analysis conducted on geographies consisting of 94,015,951 people shows a slight negative correlation between the proportion of Ugandans and percentage of population with hearing disability in the United States with a correlation coefficient (R) of -0.094 and weighted average of 2.9%, a difference of 5.1%.
Hearing Disability Correlation Summary
| Measurement | Immigrants from Sweden | Ugandan |
| Minimum | 0.51% | 0.45% |
| Maximum | 7.7% | 9.4% |
| Range | 7.2% | 9.0% |
| Mean | 3.3% | 3.5% |
| Median | 3.1% | 2.8% |
| Interquartile 25% (IQ1) | 2.1% | 2.3% |
| Interquartile 75% (IQ3) | 4.2% | 4.1% |
| Interquartile Range (IQR) | 2.1% | 1.7% |
| Standard Deviation (Sample) | 1.6% | 2.2% |
| Standard Deviation (Population) | 1.5% | 2.2% |
Similar Demographics by Hearing Disability
Demographics Similar to Immigrants from Sweden by Hearing Disability
In terms of hearing disability, the demographic groups most similar to Immigrants from Sweden are Immigrants from Moldova (3.0%, a difference of 0.060%), Immigrants from Belgium (3.0%, a difference of 0.090%), Immigrants from Italy (3.0%, a difference of 0.12%), Bulgarian (3.0%, a difference of 0.26%), and Japanese (3.0%, a difference of 0.34%).
| Demographics | Rating | Rank | Hearing Disability |
| Immigrants | Serbia | 51.1 /100 | #173 | Average 3.0% |
| Indonesians | 50.0 /100 | #174 | Average 3.0% |
| Immigrants | Romania | 48.4 /100 | #175 | Average 3.0% |
| Panamanians | 47.0 /100 | #176 | Average 3.0% |
| Immigrants | Philippines | 46.4 /100 | #177 | Average 3.0% |
| Japanese | 46.0 /100 | #178 | Average 3.0% |
| Immigrants | Moldova | 43.1 /100 | #179 | Average 3.0% |
| Immigrants | Sweden | 42.4 /100 | #180 | Average 3.0% |
| Immigrants | Belgium | 41.5 /100 | #181 | Average 3.0% |
| Immigrants | Italy | 41.1 /100 | #182 | Average 3.0% |
| Bulgarians | 39.7 /100 | #183 | Fair 3.0% |
| Immigrants | Ireland | 37.4 /100 | #184 | Fair 3.0% |
| Immigrants | Southern Europe | 35.3 /100 | #185 | Fair 3.0% |
| Immigrants | Mexico | 34.9 /100 | #186 | Fair 3.0% |
| Blacks/African Americans | 34.7 /100 | #187 | Fair 3.0% |
Demographics Similar to Ugandans by Hearing Disability
In terms of hearing disability, the demographic groups most similar to Ugandans are Chilean (2.9%, a difference of 0.070%), Immigrants from Syria (2.9%, a difference of 0.070%), Immigrants from Kenya (2.9%, a difference of 0.13%), Soviet Union (2.9%, a difference of 0.14%), and Immigrants from Brazil (2.9%, a difference of 0.17%).
| Demographics | Rating | Rank | Hearing Disability |
| South American Indians | 86.9 /100 | #127 | Excellent 2.9% |
| Immigrants | Western Asia | 86.9 /100 | #128 | Excellent 2.9% |
| Immigrants | Uganda | 86.6 /100 | #129 | Excellent 2.9% |
| Immigrants | Vietnam | 86.5 /100 | #130 | Excellent 2.9% |
| Immigrants | Kenya | 86.1 /100 | #131 | Excellent 2.9% |
| Chileans | 85.8 /100 | #132 | Excellent 2.9% |
| Immigrants | Syria | 85.8 /100 | #133 | Excellent 2.9% |
| Ugandans | 85.5 /100 | #134 | Excellent 2.9% |
| Soviet Union | 84.8 /100 | #135 | Excellent 2.9% |
| Immigrants | Brazil | 84.6 /100 | #136 | Excellent 2.9% |
| Sri Lankans | 84.1 /100 | #137 | Excellent 2.9% |
| Immigrants | Costa Rica | 84.0 /100 | #138 | Excellent 2.9% |
| Bermudans | 83.8 /100 | #139 | Excellent 2.9% |
| Immigrants | Jordan | 83.7 /100 | #140 | Excellent 2.9% |
| Sub-Saharan Africans | 83.3 /100 | #141 | Excellent 2.9% |