Immigrants from Sudan vs Immigrants from India Disability Age Under 5
COMPARE
Immigrants from Sudan
Immigrants from India
Disability Age Under 5
Disability Age Under 5 Comparison
Immigrants from Sudan
Immigrants from India
1.3%
DISABILITY AGE UNDER 5
18.7/ 100
METRIC RATING
213th/ 347
METRIC RANK
1.0%
DISABILITY AGE UNDER 5
99.9/ 100
METRIC RATING
37th/ 347
METRIC RANK
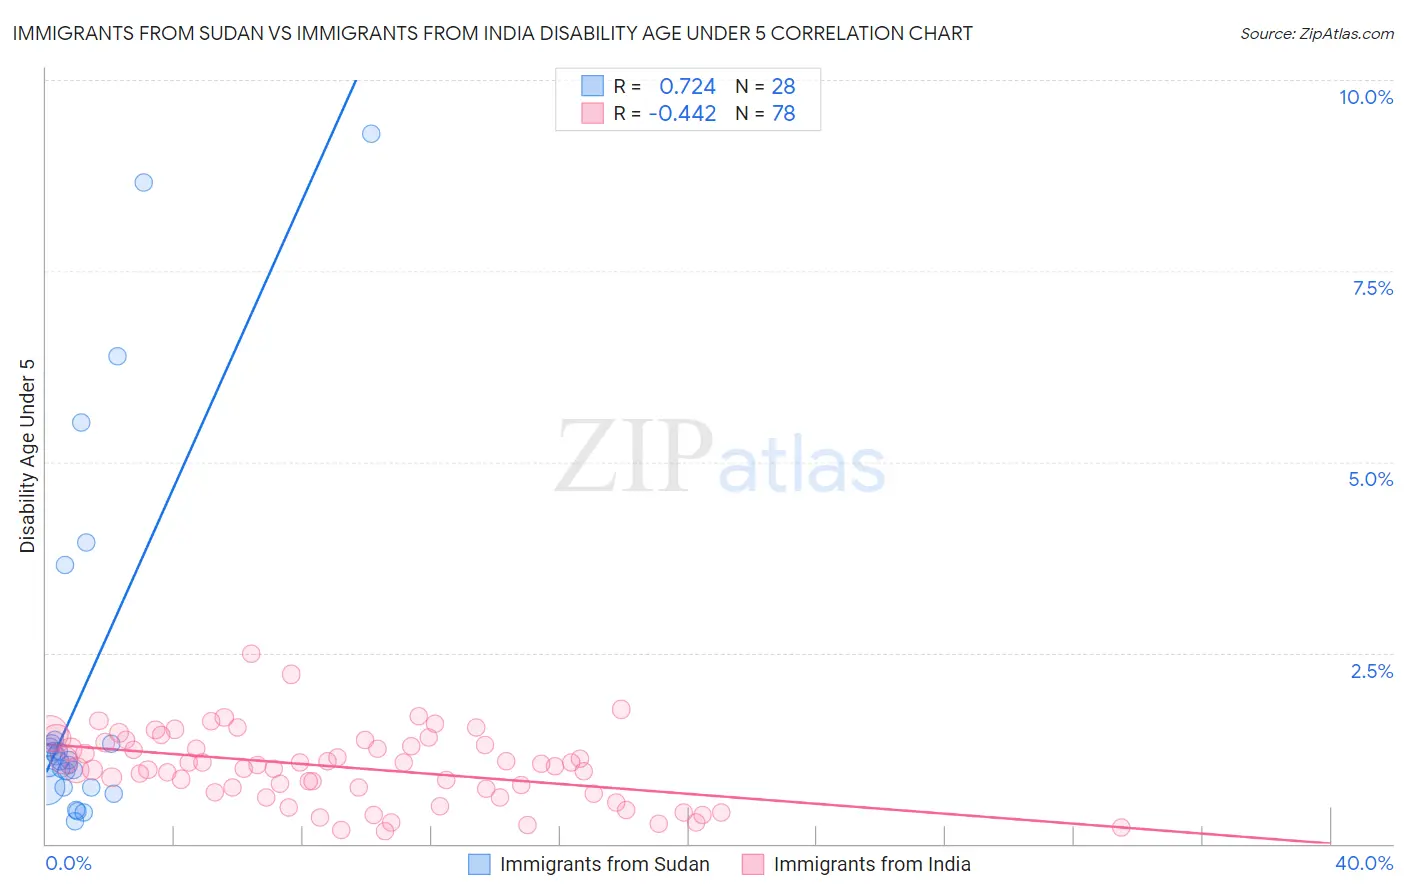
Immigrants from Sudan vs Immigrants from India Disability Age Under 5 Correlation Chart
The statistical analysis conducted on geographies consisting of 92,125,670 people shows a strong positive correlation between the proportion of Immigrants from Sudan and percentage of population with a disability under the age of 5 in the United States with a correlation coefficient (R) of 0.724 and weighted average of 1.3%. Similarly, the statistical analysis conducted on geographies consisting of 228,217,406 people shows a moderate negative correlation between the proportion of Immigrants from India and percentage of population with a disability under the age of 5 in the United States with a correlation coefficient (R) of -0.442 and weighted average of 1.0%, a difference of 22.7%.
Disability Age Under 5 Correlation Summary
| Measurement | Immigrants from Sudan | Immigrants from India |
| Minimum | 0.29% | 0.16% |
| Maximum | 9.3% | 2.5% |
| Range | 9.0% | 2.3% |
| Mean | 2.1% | 1.00% |
| Median | 1.1% | 1.0% |
| Interquartile 25% (IQ1) | 0.74% | 0.67% |
| Interquartile 75% (IQ3) | 1.3% | 1.3% |
| Interquartile Range (IQR) | 0.60% | 0.66% |
| Standard Deviation (Sample) | 2.5% | 0.47% |
| Standard Deviation (Population) | 2.4% | 0.47% |
Similar Demographics by Disability Age Under 5
Demographics Similar to Immigrants from Sudan by Disability Age Under 5
In terms of disability age under 5, the demographic groups most similar to Immigrants from Sudan are Chilean (1.3%, a difference of 0.010%), Immigrants from Greece (1.3%, a difference of 0.060%), Pakistani (1.3%, a difference of 0.10%), Bulgarian (1.3%, a difference of 0.11%), and Immigrants from Chile (1.3%, a difference of 0.23%).
| Demographics | Rating | Rank | Disability Age Under 5 |
| Immigrants | Poland | 22.4 /100 | #206 | Fair 1.3% |
| Nigerians | 21.2 /100 | #207 | Fair 1.3% |
| Mexicans | 20.8 /100 | #208 | Fair 1.3% |
| Bulgarians | 19.5 /100 | #209 | Poor 1.3% |
| Pakistanis | 19.4 /100 | #210 | Poor 1.3% |
| Immigrants | Greece | 19.1 /100 | #211 | Poor 1.3% |
| Chileans | 18.8 /100 | #212 | Poor 1.3% |
| Immigrants | Sudan | 18.7 /100 | #213 | Poor 1.3% |
| Immigrants | Chile | 17.2 /100 | #214 | Poor 1.3% |
| Syrians | 16.1 /100 | #215 | Poor 1.3% |
| Bangladeshis | 15.5 /100 | #216 | Poor 1.3% |
| Cypriots | 14.9 /100 | #217 | Poor 1.3% |
| Malaysians | 13.2 /100 | #218 | Poor 1.3% |
| Immigrants | Croatia | 11.2 /100 | #219 | Poor 1.3% |
| Serbians | 9.6 /100 | #220 | Tragic 1.3% |
Demographics Similar to Immigrants from India by Disability Age Under 5
In terms of disability age under 5, the demographic groups most similar to Immigrants from India are Immigrants from Nepal (1.0%, a difference of 0.020%), Immigrants from Guyana (1.0%, a difference of 0.080%), Barbadian (1.0%, a difference of 0.73%), Filipino (1.1%, a difference of 0.76%), and Immigrants from Ukraine (1.0%, a difference of 0.97%).
| Demographics | Rating | Rank | Disability Age Under 5 |
| Immigrants | South Central Asia | 99.9 /100 | #30 | Exceptional 1.0% |
| Armenians | 99.9 /100 | #31 | Exceptional 1.0% |
| Iranians | 99.9 /100 | #32 | Exceptional 1.0% |
| Bolivians | 99.9 /100 | #33 | Exceptional 1.0% |
| Immigrants | Ukraine | 99.9 /100 | #34 | Exceptional 1.0% |
| Barbadians | 99.9 /100 | #35 | Exceptional 1.0% |
| Immigrants | Nepal | 99.9 /100 | #36 | Exceptional 1.0% |
| Immigrants | India | 99.9 /100 | #37 | Exceptional 1.0% |
| Immigrants | Guyana | 99.9 /100 | #38 | Exceptional 1.0% |
| Filipinos | 99.9 /100 | #39 | Exceptional 1.1% |
| Immigrants | Albania | 99.9 /100 | #40 | Exceptional 1.1% |
| Thais | 99.8 /100 | #41 | Exceptional 1.1% |
| Immigrants | Bulgaria | 99.8 /100 | #42 | Exceptional 1.1% |
| Pima | 99.8 /100 | #43 | Exceptional 1.1% |
| Immigrants | Asia | 99.8 /100 | #44 | Exceptional 1.1% |