Immigrants from Sudan vs Immigrants from Cambodia Disability Age Under 5
COMPARE
Immigrants from Sudan
Immigrants from Cambodia
Disability Age Under 5
Disability Age Under 5 Comparison
Immigrants from Sudan
Immigrants from Cambodia
1.3%
DISABILITY AGE UNDER 5
18.7/ 100
METRIC RATING
213th/ 347
METRIC RANK
1.2%
DISABILITY AGE UNDER 5
90.5/ 100
METRIC RATING
124th/ 347
METRIC RANK
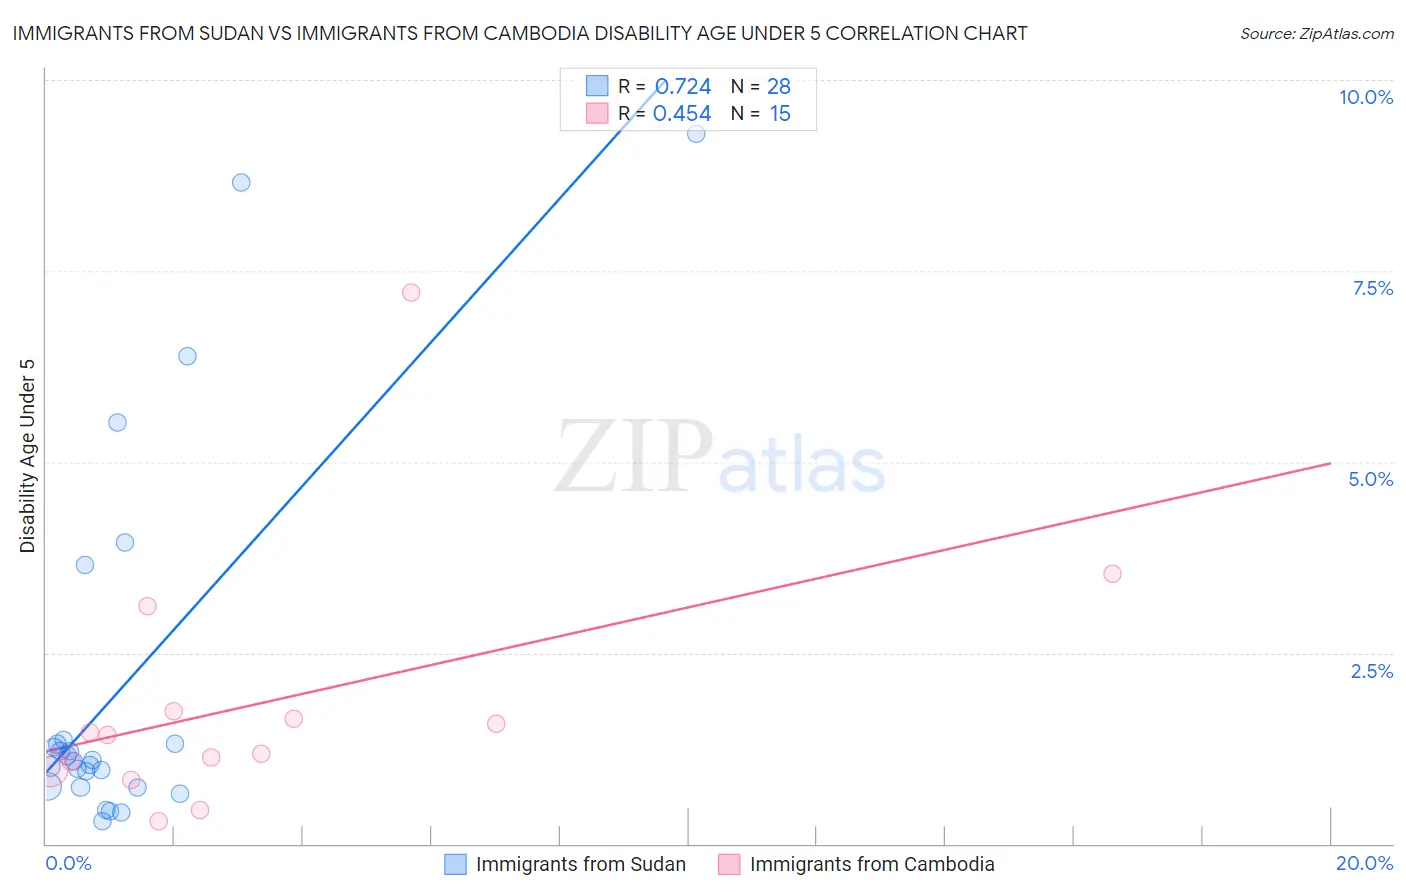
Immigrants from Sudan vs Immigrants from Cambodia Disability Age Under 5 Correlation Chart
The statistical analysis conducted on geographies consisting of 92,125,670 people shows a strong positive correlation between the proportion of Immigrants from Sudan and percentage of population with a disability under the age of 5 in the United States with a correlation coefficient (R) of 0.724 and weighted average of 1.3%. Similarly, the statistical analysis conducted on geographies consisting of 138,793,023 people shows a moderate positive correlation between the proportion of Immigrants from Cambodia and percentage of population with a disability under the age of 5 in the United States with a correlation coefficient (R) of 0.454 and weighted average of 1.2%, a difference of 8.9%.
Disability Age Under 5 Correlation Summary
| Measurement | Immigrants from Sudan | Immigrants from Cambodia |
| Minimum | 0.29% | 0.29% |
| Maximum | 9.3% | 7.2% |
| Range | 9.0% | 6.9% |
| Mean | 2.1% | 1.8% |
| Median | 1.1% | 1.4% |
| Interquartile 25% (IQ1) | 0.74% | 0.98% |
| Interquartile 75% (IQ3) | 1.3% | 1.7% |
| Interquartile Range (IQR) | 0.60% | 0.75% |
| Standard Deviation (Sample) | 2.5% | 1.7% |
| Standard Deviation (Population) | 2.4% | 1.7% |
Similar Demographics by Disability Age Under 5
Demographics Similar to Immigrants from Sudan by Disability Age Under 5
In terms of disability age under 5, the demographic groups most similar to Immigrants from Sudan are Chilean (1.3%, a difference of 0.010%), Immigrants from Greece (1.3%, a difference of 0.060%), Pakistani (1.3%, a difference of 0.10%), Bulgarian (1.3%, a difference of 0.11%), and Immigrants from Chile (1.3%, a difference of 0.23%).
| Demographics | Rating | Rank | Disability Age Under 5 |
| Immigrants | Poland | 22.4 /100 | #206 | Fair 1.3% |
| Nigerians | 21.2 /100 | #207 | Fair 1.3% |
| Mexicans | 20.8 /100 | #208 | Fair 1.3% |
| Bulgarians | 19.5 /100 | #209 | Poor 1.3% |
| Pakistanis | 19.4 /100 | #210 | Poor 1.3% |
| Immigrants | Greece | 19.1 /100 | #211 | Poor 1.3% |
| Chileans | 18.8 /100 | #212 | Poor 1.3% |
| Immigrants | Sudan | 18.7 /100 | #213 | Poor 1.3% |
| Immigrants | Chile | 17.2 /100 | #214 | Poor 1.3% |
| Syrians | 16.1 /100 | #215 | Poor 1.3% |
| Bangladeshis | 15.5 /100 | #216 | Poor 1.3% |
| Cypriots | 14.9 /100 | #217 | Poor 1.3% |
| Malaysians | 13.2 /100 | #218 | Poor 1.3% |
| Immigrants | Croatia | 11.2 /100 | #219 | Poor 1.3% |
| Serbians | 9.6 /100 | #220 | Tragic 1.3% |
Demographics Similar to Immigrants from Cambodia by Disability Age Under 5
In terms of disability age under 5, the demographic groups most similar to Immigrants from Cambodia are Zimbabwean (1.2%, a difference of 0.020%), Japanese (1.2%, a difference of 0.060%), Aleut (1.2%, a difference of 0.070%), Central American (1.2%, a difference of 0.22%), and Immigrants from Senegal (1.2%, a difference of 0.26%).
| Demographics | Rating | Rank | Disability Age Under 5 |
| Immigrants | Philippines | 93.5 /100 | #117 | Exceptional 1.2% |
| Immigrants | Venezuela | 93.4 /100 | #118 | Exceptional 1.2% |
| Bhutanese | 92.5 /100 | #119 | Exceptional 1.2% |
| Immigrants | Eritrea | 92.3 /100 | #120 | Exceptional 1.2% |
| Immigrants | Senegal | 91.4 /100 | #121 | Exceptional 1.2% |
| Aleuts | 90.7 /100 | #122 | Exceptional 1.2% |
| Zimbabweans | 90.6 /100 | #123 | Exceptional 1.2% |
| Immigrants | Cambodia | 90.5 /100 | #124 | Exceptional 1.2% |
| Japanese | 90.3 /100 | #125 | Exceptional 1.2% |
| Central Americans | 89.7 /100 | #126 | Excellent 1.2% |
| Immigrants | Romania | 88.4 /100 | #127 | Excellent 1.2% |
| Immigrants | France | 88.4 /100 | #128 | Excellent 1.2% |
| Immigrants | Immigrants | 88.0 /100 | #129 | Excellent 1.2% |
| Koreans | 87.7 /100 | #130 | Excellent 1.2% |
| Immigrants | Serbia | 87.6 /100 | #131 | Excellent 1.2% |