Immigrants from Sudan vs Immigrants from South America Disability Age Under 5
COMPARE
Immigrants from Sudan
Immigrants from South America
Disability Age Under 5
Disability Age Under 5 Comparison
Immigrants from Sudan
Immigrants from South America
1.3%
DISABILITY AGE UNDER 5
18.7/ 100
METRIC RATING
213th/ 347
METRIC RANK
1.2%
DISABILITY AGE UNDER 5
67.0/ 100
METRIC RATING
157th/ 347
METRIC RANK
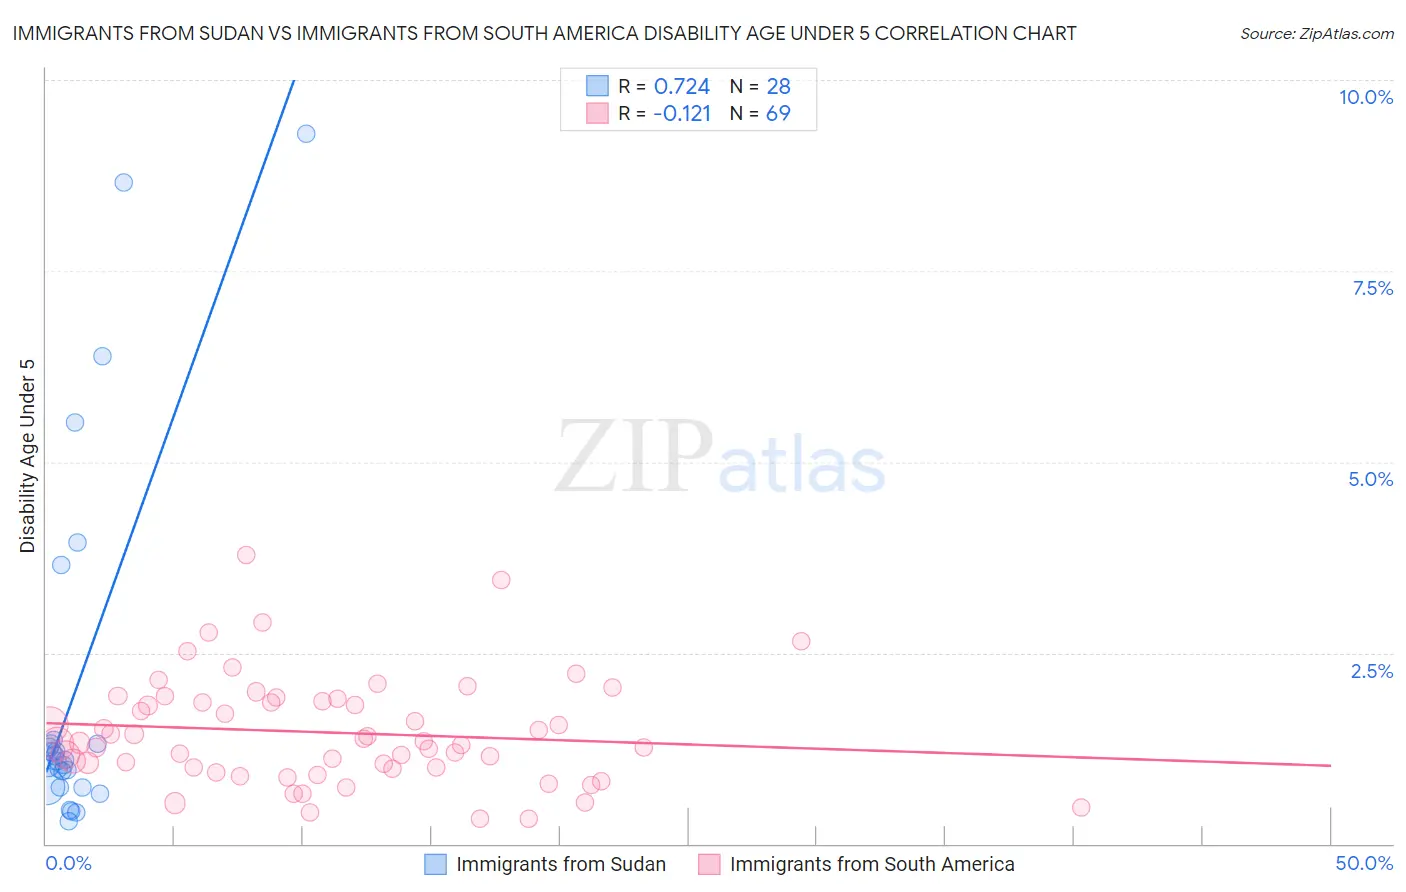
Immigrants from Sudan vs Immigrants from South America Disability Age Under 5 Correlation Chart
The statistical analysis conducted on geographies consisting of 92,125,670 people shows a strong positive correlation between the proportion of Immigrants from Sudan and percentage of population with a disability under the age of 5 in the United States with a correlation coefficient (R) of 0.724 and weighted average of 1.3%. Similarly, the statistical analysis conducted on geographies consisting of 244,519,101 people shows a poor negative correlation between the proportion of Immigrants from South America and percentage of population with a disability under the age of 5 in the United States with a correlation coefficient (R) of -0.121 and weighted average of 1.2%, a difference of 5.0%.
Disability Age Under 5 Correlation Summary
| Measurement | Immigrants from Sudan | Immigrants from South America |
| Minimum | 0.29% | 0.32% |
| Maximum | 9.3% | 3.8% |
| Range | 9.0% | 3.5% |
| Mean | 2.1% | 1.5% |
| Median | 1.1% | 1.3% |
| Interquartile 25% (IQ1) | 0.74% | 0.99% |
| Interquartile 75% (IQ3) | 1.3% | 1.9% |
| Interquartile Range (IQR) | 0.60% | 0.89% |
| Standard Deviation (Sample) | 2.5% | 0.70% |
| Standard Deviation (Population) | 2.4% | 0.70% |
Similar Demographics by Disability Age Under 5
Demographics Similar to Immigrants from Sudan by Disability Age Under 5
In terms of disability age under 5, the demographic groups most similar to Immigrants from Sudan are Chilean (1.3%, a difference of 0.010%), Immigrants from Greece (1.3%, a difference of 0.060%), Pakistani (1.3%, a difference of 0.10%), Bulgarian (1.3%, a difference of 0.11%), and Immigrants from Chile (1.3%, a difference of 0.23%).
| Demographics | Rating | Rank | Disability Age Under 5 |
| Immigrants | Poland | 22.4 /100 | #206 | Fair 1.3% |
| Nigerians | 21.2 /100 | #207 | Fair 1.3% |
| Mexicans | 20.8 /100 | #208 | Fair 1.3% |
| Bulgarians | 19.5 /100 | #209 | Poor 1.3% |
| Pakistanis | 19.4 /100 | #210 | Poor 1.3% |
| Immigrants | Greece | 19.1 /100 | #211 | Poor 1.3% |
| Chileans | 18.8 /100 | #212 | Poor 1.3% |
| Immigrants | Sudan | 18.7 /100 | #213 | Poor 1.3% |
| Immigrants | Chile | 17.2 /100 | #214 | Poor 1.3% |
| Syrians | 16.1 /100 | #215 | Poor 1.3% |
| Bangladeshis | 15.5 /100 | #216 | Poor 1.3% |
| Cypriots | 14.9 /100 | #217 | Poor 1.3% |
| Malaysians | 13.2 /100 | #218 | Poor 1.3% |
| Immigrants | Croatia | 11.2 /100 | #219 | Poor 1.3% |
| Serbians | 9.6 /100 | #220 | Tragic 1.3% |
Demographics Similar to Immigrants from South America by Disability Age Under 5
In terms of disability age under 5, the demographic groups most similar to Immigrants from South America are Arab (1.2%, a difference of 0.060%), Colombian (1.2%, a difference of 0.12%), Immigrants from Latin America (1.2%, a difference of 0.12%), Hawaiian (1.2%, a difference of 0.16%), and Immigrants from Ghana (1.2%, a difference of 0.18%).
| Demographics | Rating | Rank | Disability Age Under 5 |
| South Americans | 75.6 /100 | #150 | Good 1.2% |
| Yaqui | 74.8 /100 | #151 | Good 1.2% |
| Hondurans | 72.5 /100 | #152 | Good 1.2% |
| Immigrants | Thailand | 69.4 /100 | #153 | Good 1.2% |
| Uruguayans | 68.8 /100 | #154 | Good 1.2% |
| Immigrants | Ghana | 68.7 /100 | #155 | Good 1.2% |
| Hawaiians | 68.5 /100 | #156 | Good 1.2% |
| Immigrants | South America | 67.0 /100 | #157 | Good 1.2% |
| Arabs | 66.4 /100 | #158 | Good 1.2% |
| Colombians | 65.8 /100 | #159 | Good 1.2% |
| Immigrants | Latin America | 65.8 /100 | #160 | Good 1.2% |
| Immigrants | Africa | 65.1 /100 | #161 | Good 1.2% |
| Guatemalans | 63.6 /100 | #162 | Good 1.2% |
| Immigrants | Guatemala | 63.2 /100 | #163 | Good 1.2% |
| Laotians | 62.8 /100 | #164 | Good 1.2% |