Spanish American vs Immigrants from India Disability Age Under 5
COMPARE
Spanish American
Immigrants from India
Disability Age Under 5
Disability Age Under 5 Comparison
Spanish Americans
Immigrants from India
1.1%
DISABILITY AGE UNDER 5
96.9/ 100
METRIC RATING
93rd/ 347
METRIC RANK
1.0%
DISABILITY AGE UNDER 5
99.9/ 100
METRIC RATING
37th/ 347
METRIC RANK
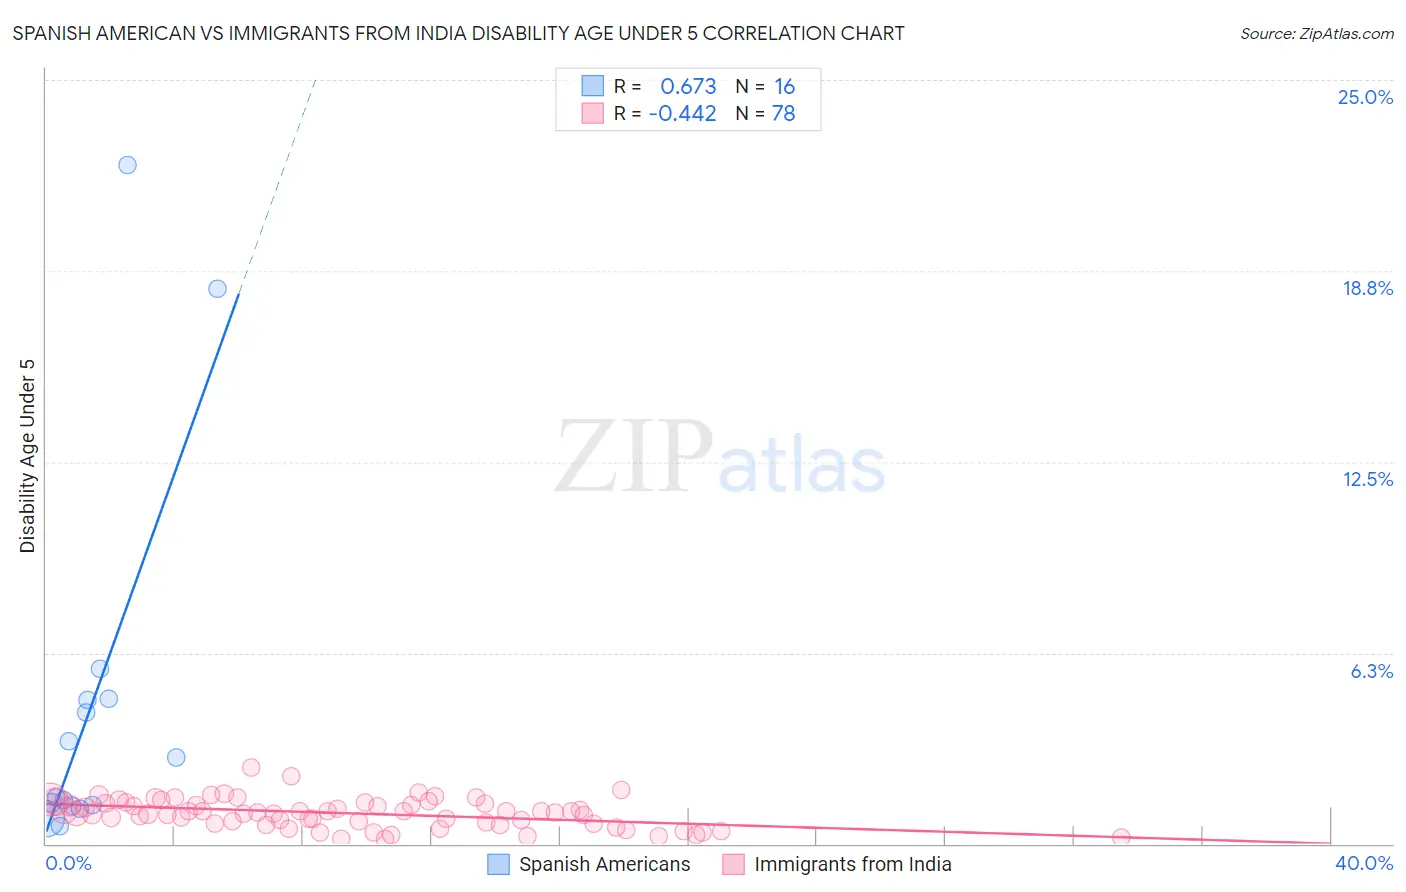
Spanish American vs Immigrants from India Disability Age Under 5 Correlation Chart
The statistical analysis conducted on geographies consisting of 83,596,230 people shows a significant positive correlation between the proportion of Spanish Americans and percentage of population with a disability under the age of 5 in the United States with a correlation coefficient (R) of 0.673 and weighted average of 1.1%. Similarly, the statistical analysis conducted on geographies consisting of 228,217,406 people shows a moderate negative correlation between the proportion of Immigrants from India and percentage of population with a disability under the age of 5 in the United States with a correlation coefficient (R) of -0.442 and weighted average of 1.0%, a difference of 9.5%.
Disability Age Under 5 Correlation Summary
| Measurement | Spanish American | Immigrants from India |
| Minimum | 0.56% | 0.16% |
| Maximum | 22.2% | 2.5% |
| Range | 21.7% | 2.3% |
| Mean | 4.7% | 1.00% |
| Median | 2.2% | 1.0% |
| Interquartile 25% (IQ1) | 1.3% | 0.67% |
| Interquartile 75% (IQ3) | 4.7% | 1.3% |
| Interquartile Range (IQR) | 3.5% | 0.66% |
| Standard Deviation (Sample) | 6.3% | 0.47% |
| Standard Deviation (Population) | 6.1% | 0.47% |
Similar Demographics by Disability Age Under 5
Demographics Similar to Spanish Americans by Disability Age Under 5
In terms of disability age under 5, the demographic groups most similar to Spanish Americans are Immigrants from Cuba (1.1%, a difference of 0.030%), Sri Lankan (1.1%, a difference of 0.060%), Immigrants from Moldova (1.1%, a difference of 0.11%), Albanian (1.1%, a difference of 0.20%), and Mongolian (1.1%, a difference of 0.22%).
| Demographics | Rating | Rank | Disability Age Under 5 |
| Okinawans | 97.6 /100 | #86 | Exceptional 1.1% |
| Ugandans | 97.5 /100 | #87 | Exceptional 1.1% |
| Immigrants | Dominican Republic | 97.5 /100 | #88 | Exceptional 1.1% |
| Ethiopians | 97.2 /100 | #89 | Exceptional 1.1% |
| Chinese | 97.2 /100 | #90 | Exceptional 1.1% |
| Albanians | 97.2 /100 | #91 | Exceptional 1.1% |
| Immigrants | Cuba | 97.0 /100 | #92 | Exceptional 1.1% |
| Spanish Americans | 96.9 /100 | #93 | Exceptional 1.1% |
| Sri Lankans | 96.8 /100 | #94 | Exceptional 1.1% |
| Immigrants | Moldova | 96.8 /100 | #95 | Exceptional 1.1% |
| Mongolians | 96.6 /100 | #96 | Exceptional 1.1% |
| Immigrants | Iraq | 96.5 /100 | #97 | Exceptional 1.1% |
| Immigrants | South Eastern Asia | 96.5 /100 | #98 | Exceptional 1.1% |
| Dominicans | 96.3 /100 | #99 | Exceptional 1.1% |
| Nicaraguans | 96.3 /100 | #100 | Exceptional 1.1% |
Demographics Similar to Immigrants from India by Disability Age Under 5
In terms of disability age under 5, the demographic groups most similar to Immigrants from India are Immigrants from Nepal (1.0%, a difference of 0.020%), Immigrants from Guyana (1.0%, a difference of 0.080%), Barbadian (1.0%, a difference of 0.73%), Filipino (1.1%, a difference of 0.76%), and Immigrants from Ukraine (1.0%, a difference of 0.97%).
| Demographics | Rating | Rank | Disability Age Under 5 |
| Immigrants | South Central Asia | 99.9 /100 | #30 | Exceptional 1.0% |
| Armenians | 99.9 /100 | #31 | Exceptional 1.0% |
| Iranians | 99.9 /100 | #32 | Exceptional 1.0% |
| Bolivians | 99.9 /100 | #33 | Exceptional 1.0% |
| Immigrants | Ukraine | 99.9 /100 | #34 | Exceptional 1.0% |
| Barbadians | 99.9 /100 | #35 | Exceptional 1.0% |
| Immigrants | Nepal | 99.9 /100 | #36 | Exceptional 1.0% |
| Immigrants | India | 99.9 /100 | #37 | Exceptional 1.0% |
| Immigrants | Guyana | 99.9 /100 | #38 | Exceptional 1.0% |
| Filipinos | 99.9 /100 | #39 | Exceptional 1.1% |
| Immigrants | Albania | 99.9 /100 | #40 | Exceptional 1.1% |
| Thais | 99.8 /100 | #41 | Exceptional 1.1% |
| Immigrants | Bulgaria | 99.8 /100 | #42 | Exceptional 1.1% |
| Pima | 99.8 /100 | #43 | Exceptional 1.1% |
| Immigrants | Asia | 99.8 /100 | #44 | Exceptional 1.1% |