Immigrants from Sudan vs Alaskan Athabascan Disability Age 65 to 74
COMPARE
Immigrants from Sudan
Alaskan Athabascan
Disability Age 65 to 74
Disability Age 65 to 74 Comparison
Immigrants from Sudan
Alaskan Athabascans
23.8%
DISABILITY AGE 65 TO 74
20.1/ 100
METRIC RATING
207th/ 347
METRIC RANK
32.4%
DISABILITY AGE 65 TO 74
0.0/ 100
METRIC RATING
338th/ 347
METRIC RANK
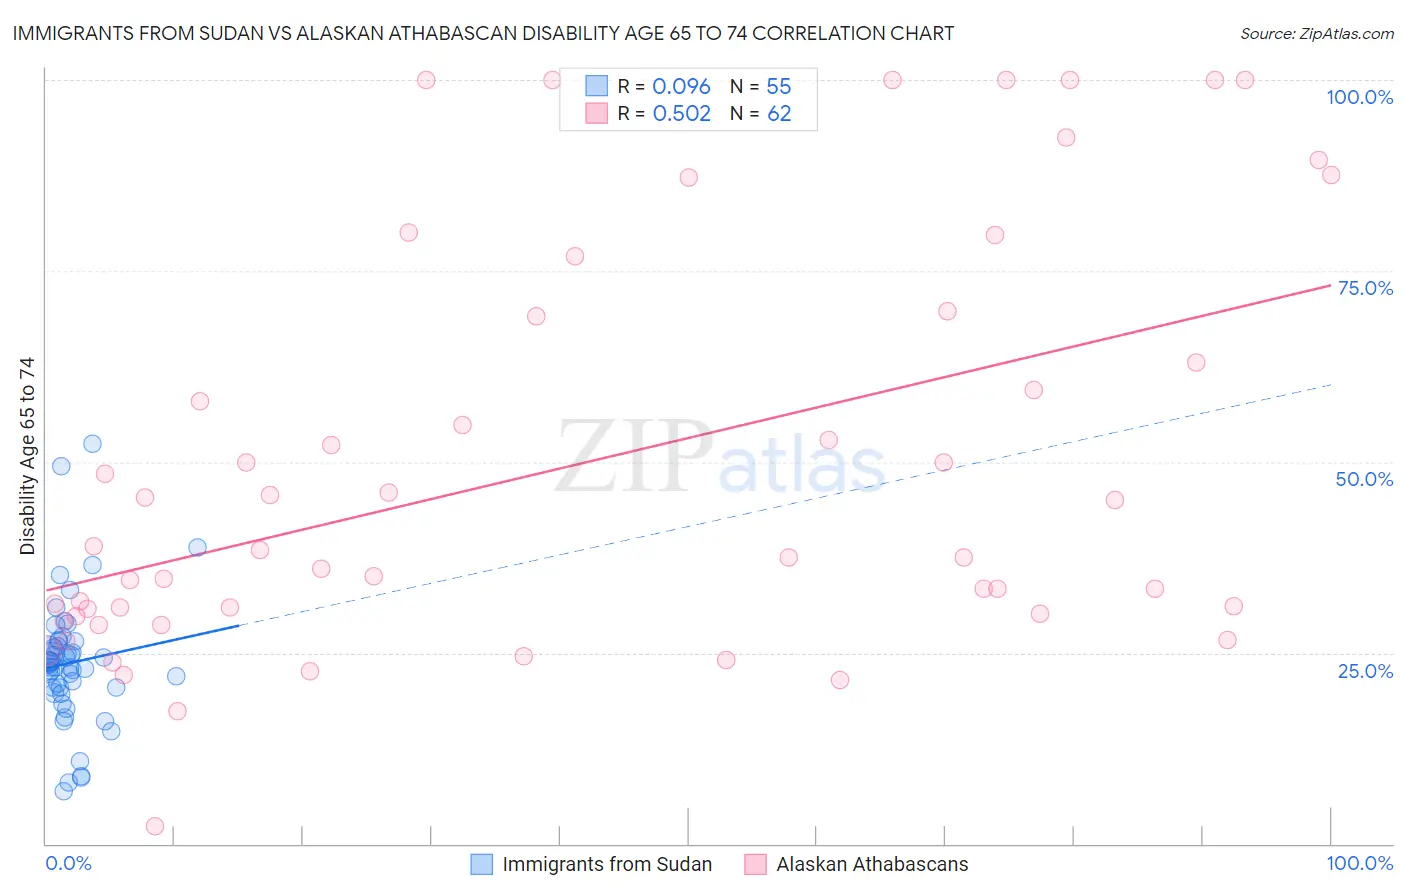
Immigrants from Sudan vs Alaskan Athabascan Disability Age 65 to 74 Correlation Chart
The statistical analysis conducted on geographies consisting of 118,890,576 people shows a slight positive correlation between the proportion of Immigrants from Sudan and percentage of population with a disability between the ages 65 and 75 in the United States with a correlation coefficient (R) of 0.096 and weighted average of 23.8%. Similarly, the statistical analysis conducted on geographies consisting of 45,797,821 people shows a substantial positive correlation between the proportion of Alaskan Athabascans and percentage of population with a disability between the ages 65 and 75 in the United States with a correlation coefficient (R) of 0.502 and weighted average of 32.4%, a difference of 35.9%.
Disability Age 65 to 74 Correlation Summary
| Measurement | Immigrants from Sudan | Alaskan Athabascan |
| Minimum | 6.8% | 2.3% |
| Maximum | 52.4% | 100.0% |
| Range | 45.6% | 97.7% |
| Mean | 23.7% | 49.4% |
| Median | 23.6% | 38.0% |
| Interquartile 25% (IQ1) | 20.4% | 30.1% |
| Interquartile 75% (IQ3) | 26.5% | 69.1% |
| Interquartile Range (IQR) | 6.0% | 39.0% |
| Standard Deviation (Sample) | 8.4% | 26.6% |
| Standard Deviation (Population) | 8.4% | 26.4% |
Similar Demographics by Disability Age 65 to 74
Demographics Similar to Immigrants from Sudan by Disability Age 65 to 74
In terms of disability age 65 to 74, the demographic groups most similar to Immigrants from Sudan are Immigrants from Barbados (23.8%, a difference of 0.040%), Immigrants from Kenya (23.8%, a difference of 0.050%), Tongan (23.8%, a difference of 0.060%), Immigrants from Jamaica (23.8%, a difference of 0.060%), and Immigrants from Grenada (23.8%, a difference of 0.17%).
| Demographics | Rating | Rank | Disability Age 65 to 74 |
| French Canadians | 24.0 /100 | #200 | Fair 23.7% |
| Immigrants | Ecuador | 23.9 /100 | #201 | Fair 23.7% |
| Immigrants | Bahamas | 23.3 /100 | #202 | Fair 23.7% |
| Kenyans | 23.2 /100 | #203 | Fair 23.7% |
| Immigrants | Grenada | 22.1 /100 | #204 | Fair 23.8% |
| Tongans | 20.8 /100 | #205 | Fair 23.8% |
| Immigrants | Jamaica | 20.7 /100 | #206 | Fair 23.8% |
| Immigrants | Sudan | 20.1 /100 | #207 | Fair 23.8% |
| Immigrants | Barbados | 19.6 /100 | #208 | Poor 23.8% |
| Immigrants | Kenya | 19.6 /100 | #209 | Poor 23.8% |
| Trinidadians and Tobagonians | 16.4 /100 | #210 | Poor 23.9% |
| Immigrants | West Indies | 15.9 /100 | #211 | Poor 23.9% |
| French | 15.7 /100 | #212 | Poor 23.9% |
| Nicaraguans | 14.3 /100 | #213 | Poor 23.9% |
| Immigrants | Oceania | 13.6 /100 | #214 | Poor 24.0% |
Demographics Similar to Alaskan Athabascans by Disability Age 65 to 74
In terms of disability age 65 to 74, the demographic groups most similar to Alaskan Athabascans are Houma (32.3%, a difference of 0.19%), Kiowa (32.6%, a difference of 0.62%), Lumbee (32.7%, a difference of 1.1%), Tsimshian (32.9%, a difference of 1.7%), and Pueblo (33.1%, a difference of 2.3%).
| Demographics | Rating | Rank | Disability Age 65 to 74 |
| Chickasaw | 0.0 /100 | #331 | Tragic 30.2% |
| Natives/Alaskans | 0.0 /100 | #332 | Tragic 30.4% |
| Colville | 0.0 /100 | #333 | Tragic 30.5% |
| Alaska Natives | 0.0 /100 | #334 | Tragic 30.6% |
| Cheyenne | 0.0 /100 | #335 | Tragic 31.1% |
| Yuman | 0.0 /100 | #336 | Tragic 31.5% |
| Houma | 0.0 /100 | #337 | Tragic 32.3% |
| Alaskan Athabascans | 0.0 /100 | #338 | Tragic 32.4% |
| Kiowa | 0.0 /100 | #339 | Tragic 32.6% |
| Lumbee | 0.0 /100 | #340 | Tragic 32.7% |
| Tsimshian | 0.0 /100 | #341 | Tragic 32.9% |
| Pueblo | 0.0 /100 | #342 | Tragic 33.1% |
| Navajo | 0.0 /100 | #343 | Tragic 33.3% |
| Inupiat | 0.0 /100 | #344 | Tragic 34.5% |
| Tohono O'odham | 0.0 /100 | #345 | Tragic 36.0% |