Immigrants from Sudan vs Alaskan Athabascan Unemployment
COMPARE
Immigrants from Sudan
Alaskan Athabascan
Unemployment
Unemployment Comparison
Immigrants from Sudan
Alaskan Athabascans
5.0%
UNEMPLOYMENT
96.3/ 100
METRIC RATING
91st/ 347
METRIC RANK
7.7%
UNEMPLOYMENT
0.0/ 100
METRIC RATING
335th/ 347
METRIC RANK
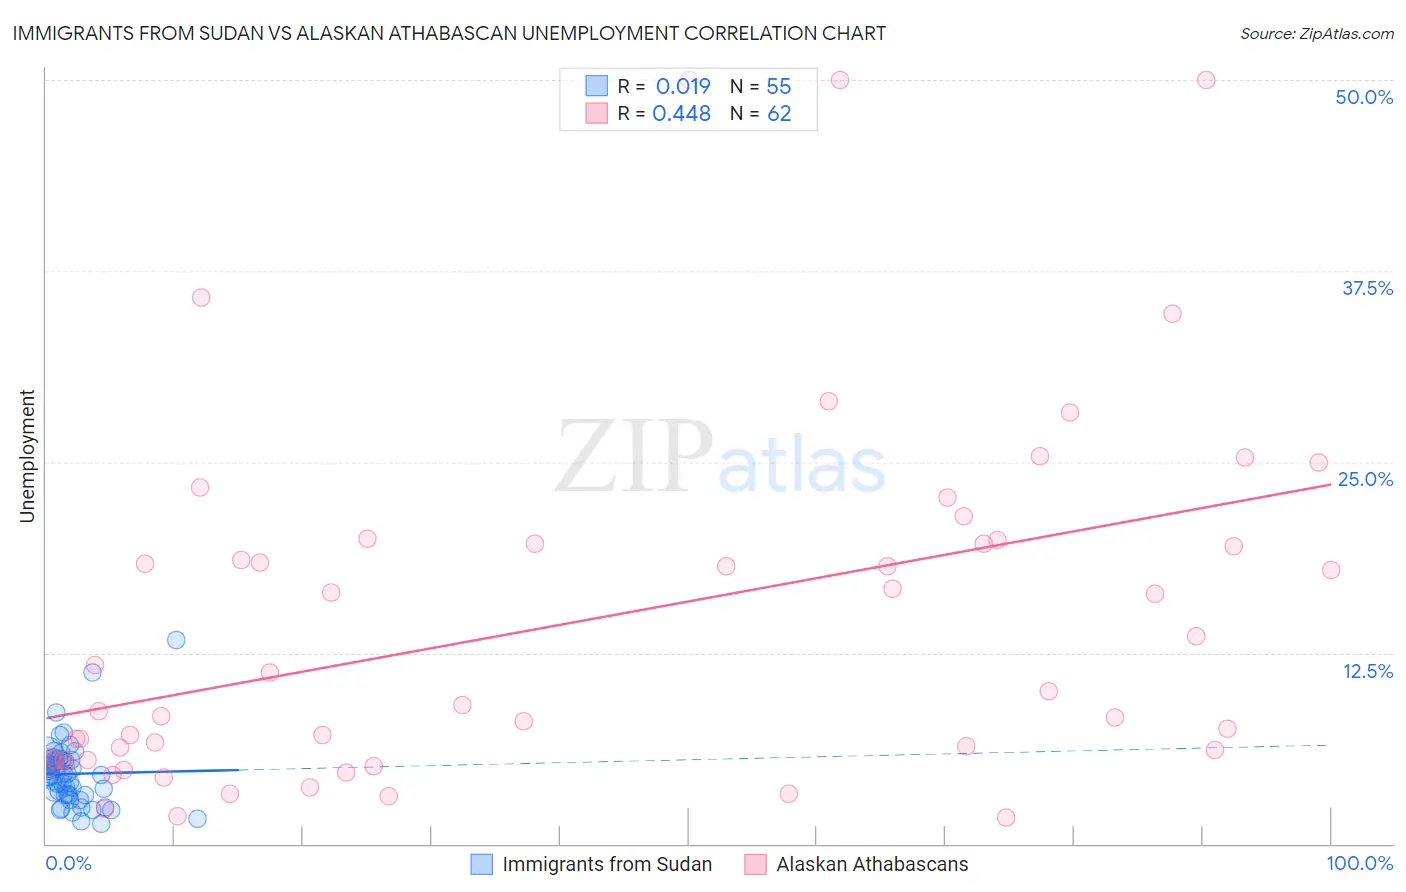
Immigrants from Sudan vs Alaskan Athabascan Unemployment Correlation Chart
The statistical analysis conducted on geographies consisting of 118,944,450 people shows no correlation between the proportion of Immigrants from Sudan and unemployment in the United States with a correlation coefficient (R) of 0.019 and weighted average of 5.0%. Similarly, the statistical analysis conducted on geographies consisting of 45,810,062 people shows a moderate positive correlation between the proportion of Alaskan Athabascans and unemployment in the United States with a correlation coefficient (R) of 0.448 and weighted average of 7.7%, a difference of 53.2%.
Unemployment Correlation Summary
| Measurement | Immigrants from Sudan | Alaskan Athabascan |
| Minimum | 1.3% | 1.7% |
| Maximum | 13.3% | 50.0% |
| Range | 12.0% | 48.3% |
| Mean | 4.6% | 14.5% |
| Median | 4.5% | 9.6% |
| Interquartile 25% (IQ1) | 3.2% | 5.5% |
| Interquartile 75% (IQ3) | 5.5% | 19.6% |
| Interquartile Range (IQR) | 2.3% | 14.1% |
| Standard Deviation (Sample) | 2.2% | 11.8% |
| Standard Deviation (Population) | 2.2% | 11.7% |
Similar Demographics by Unemployment
Demographics Similar to Immigrants from Sudan by Unemployment
In terms of unemployment, the demographic groups most similar to Immigrants from Sudan are Immigrants from North Macedonia (5.0%, a difference of 0.010%), Immigrants from South Africa (5.0%, a difference of 0.020%), Jordanian (5.0%, a difference of 0.050%), Ukrainian (5.0%, a difference of 0.11%), and Immigrants from Korea (5.0%, a difference of 0.14%).
| Demographics | Rating | Rank | Unemployment |
| Russians | 97.4 /100 | #84 | Exceptional 5.0% |
| Immigrants | Australia | 97.0 /100 | #85 | Exceptional 5.0% |
| Hungarians | 96.9 /100 | #86 | Exceptional 5.0% |
| Immigrants | Moldova | 96.6 /100 | #87 | Exceptional 5.0% |
| Immigrants | Korea | 96.6 /100 | #88 | Exceptional 5.0% |
| Jordanians | 96.4 /100 | #89 | Exceptional 5.0% |
| Immigrants | North Macedonia | 96.3 /100 | #90 | Exceptional 5.0% |
| Immigrants | Sudan | 96.3 /100 | #91 | Exceptional 5.0% |
| Immigrants | South Africa | 96.2 /100 | #92 | Exceptional 5.0% |
| Ukrainians | 96.0 /100 | #93 | Exceptional 5.0% |
| Immigrants | Austria | 95.9 /100 | #94 | Exceptional 5.0% |
| Immigrants | Serbia | 95.6 /100 | #95 | Exceptional 5.0% |
| Immigrants | England | 95.2 /100 | #96 | Exceptional 5.0% |
| Immigrants | Czechoslovakia | 95.1 /100 | #97 | Exceptional 5.0% |
| Romanians | 95.0 /100 | #98 | Exceptional 5.0% |
Demographics Similar to Alaskan Athabascans by Unemployment
In terms of unemployment, the demographic groups most similar to Alaskan Athabascans are Immigrants from Yemen (7.7%, a difference of 0.72%), Apache (7.4%, a difference of 3.0%), Immigrants from Dominican Republic (7.4%, a difference of 3.5%), Sioux (7.4%, a difference of 3.6%), and Dominican (7.4%, a difference of 4.0%).
| Demographics | Rating | Rank | Unemployment |
| Tsimshian | 0.0 /100 | #328 | Tragic 7.2% |
| Alaska Natives | 0.0 /100 | #329 | Tragic 7.2% |
| Yakama | 0.0 /100 | #330 | Tragic 7.3% |
| Dominicans | 0.0 /100 | #331 | Tragic 7.4% |
| Sioux | 0.0 /100 | #332 | Tragic 7.4% |
| Immigrants | Dominican Republic | 0.0 /100 | #333 | Tragic 7.4% |
| Apache | 0.0 /100 | #334 | Tragic 7.4% |
| Alaskan Athabascans | 0.0 /100 | #335 | Tragic 7.7% |
| Immigrants | Yemen | 0.0 /100 | #336 | Tragic 7.7% |
| Cheyenne | 0.0 /100 | #337 | Tragic 8.0% |
| Pima | 0.0 /100 | #338 | Tragic 8.2% |
| Navajo | 0.0 /100 | #339 | Tragic 8.4% |
| Puerto Ricans | 0.0 /100 | #340 | Tragic 8.4% |
| Tohono O'odham | 0.0 /100 | #341 | Tragic 8.9% |
| Hopi | 0.0 /100 | #342 | Tragic 8.9% |