Immigrants from Sudan vs Immigrants from Bangladesh Disability Age 65 to 74
COMPARE
Immigrants from Sudan
Immigrants from Bangladesh
Disability Age 65 to 74
Disability Age 65 to 74 Comparison
Immigrants from Sudan
Immigrants from Bangladesh
23.8%
DISABILITY AGE 65 TO 74
20.1/ 100
METRIC RATING
207th/ 347
METRIC RANK
23.6%
DISABILITY AGE 65 TO 74
30.2/ 100
METRIC RATING
191st/ 347
METRIC RANK
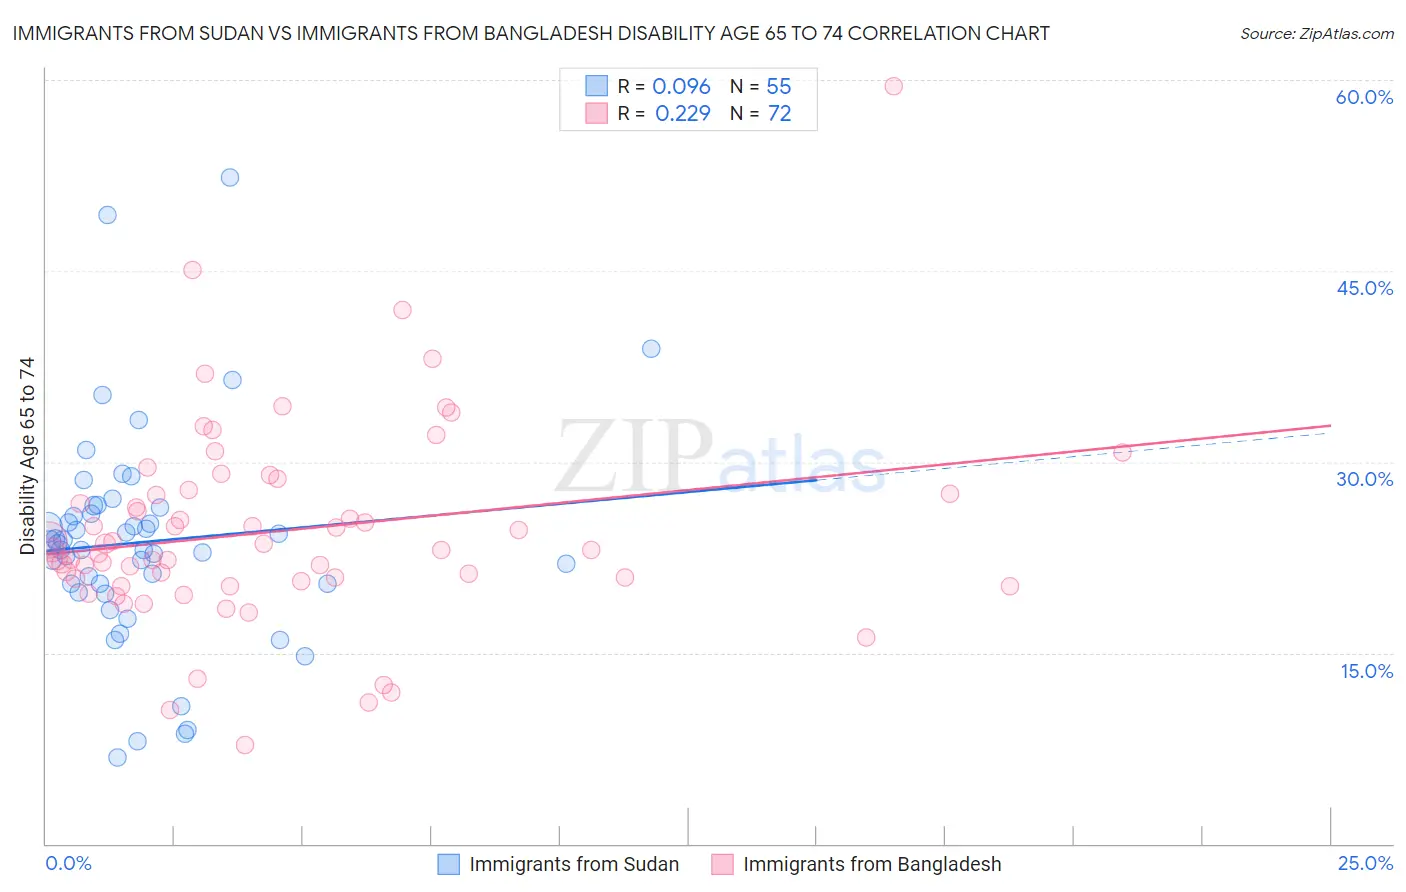
Immigrants from Sudan vs Immigrants from Bangladesh Disability Age 65 to 74 Correlation Chart
The statistical analysis conducted on geographies consisting of 118,890,576 people shows a slight positive correlation between the proportion of Immigrants from Sudan and percentage of population with a disability between the ages 65 and 75 in the United States with a correlation coefficient (R) of 0.096 and weighted average of 23.8%. Similarly, the statistical analysis conducted on geographies consisting of 203,421,949 people shows a weak positive correlation between the proportion of Immigrants from Bangladesh and percentage of population with a disability between the ages 65 and 75 in the United States with a correlation coefficient (R) of 0.229 and weighted average of 23.6%, a difference of 0.78%.
Disability Age 65 to 74 Correlation Summary
| Measurement | Immigrants from Sudan | Immigrants from Bangladesh |
| Minimum | 6.8% | 7.8% |
| Maximum | 52.4% | 59.5% |
| Range | 45.6% | 51.7% |
| Mean | 23.7% | 24.6% |
| Median | 23.6% | 23.1% |
| Interquartile 25% (IQ1) | 20.4% | 20.7% |
| Interquartile 75% (IQ3) | 26.5% | 27.7% |
| Interquartile Range (IQR) | 6.0% | 6.9% |
| Standard Deviation (Sample) | 8.4% | 8.0% |
| Standard Deviation (Population) | 8.4% | 7.9% |
Demographics Similar to Immigrants from Sudan and Immigrants from Bangladesh by Disability Age 65 to 74
In terms of disability age 65 to 74, the demographic groups most similar to Immigrants from Sudan are Immigrants from Barbados (23.8%, a difference of 0.040%), Immigrants from Kenya (23.8%, a difference of 0.050%), Tongan (23.8%, a difference of 0.060%), Immigrants from Jamaica (23.8%, a difference of 0.060%), and Immigrants from Grenada (23.8%, a difference of 0.17%). Similarly, the demographic groups most similar to Immigrants from Bangladesh are Ecuadorian (23.6%, a difference of 0.030%), Immigrants from Guyana (23.6%, a difference of 0.070%), English (23.6%, a difference of 0.12%), Sudanese (23.7%, a difference of 0.17%), and Scottish (23.6%, a difference of 0.19%).
| Demographics | Rating | Rank | Disability Age 65 to 74 |
| Scottish | 33.1 /100 | #189 | Fair 23.6% |
| Immigrants | Guyana | 31.2 /100 | #190 | Fair 23.6% |
| Immigrants | Bangladesh | 30.2 /100 | #191 | Fair 23.6% |
| Ecuadorians | 29.7 /100 | #192 | Fair 23.6% |
| English | 28.5 /100 | #193 | Fair 23.6% |
| Sudanese | 27.8 /100 | #194 | Fair 23.7% |
| Immigrants | St. Vincent and the Grenadines | 26.1 /100 | #195 | Fair 23.7% |
| Immigrants | Trinidad and Tobago | 26.1 /100 | #196 | Fair 23.7% |
| Immigrants | Immigrants | 25.8 /100 | #197 | Fair 23.7% |
| Immigrants | Africa | 24.4 /100 | #198 | Fair 23.7% |
| Welsh | 24.3 /100 | #199 | Fair 23.7% |
| French Canadians | 24.0 /100 | #200 | Fair 23.7% |
| Immigrants | Ecuador | 23.9 /100 | #201 | Fair 23.7% |
| Immigrants | Bahamas | 23.3 /100 | #202 | Fair 23.7% |
| Kenyans | 23.2 /100 | #203 | Fair 23.7% |
| Immigrants | Grenada | 22.1 /100 | #204 | Fair 23.8% |
| Tongans | 20.8 /100 | #205 | Fair 23.8% |
| Immigrants | Jamaica | 20.7 /100 | #206 | Fair 23.8% |
| Immigrants | Sudan | 20.1 /100 | #207 | Fair 23.8% |
| Immigrants | Barbados | 19.6 /100 | #208 | Poor 23.8% |
| Immigrants | Kenya | 19.6 /100 | #209 | Poor 23.8% |