Immigrants from Sudan vs Immigrants from Bolivia Disability Age 65 to 74
COMPARE
Immigrants from Sudan
Immigrants from Bolivia
Disability Age 65 to 74
Disability Age 65 to 74 Comparison
Immigrants from Sudan
Immigrants from Bolivia
23.8%
DISABILITY AGE 65 TO 74
20.1/ 100
METRIC RATING
207th/ 347
METRIC RANK
20.8%
DISABILITY AGE 65 TO 74
99.9/ 100
METRIC RATING
21st/ 347
METRIC RANK
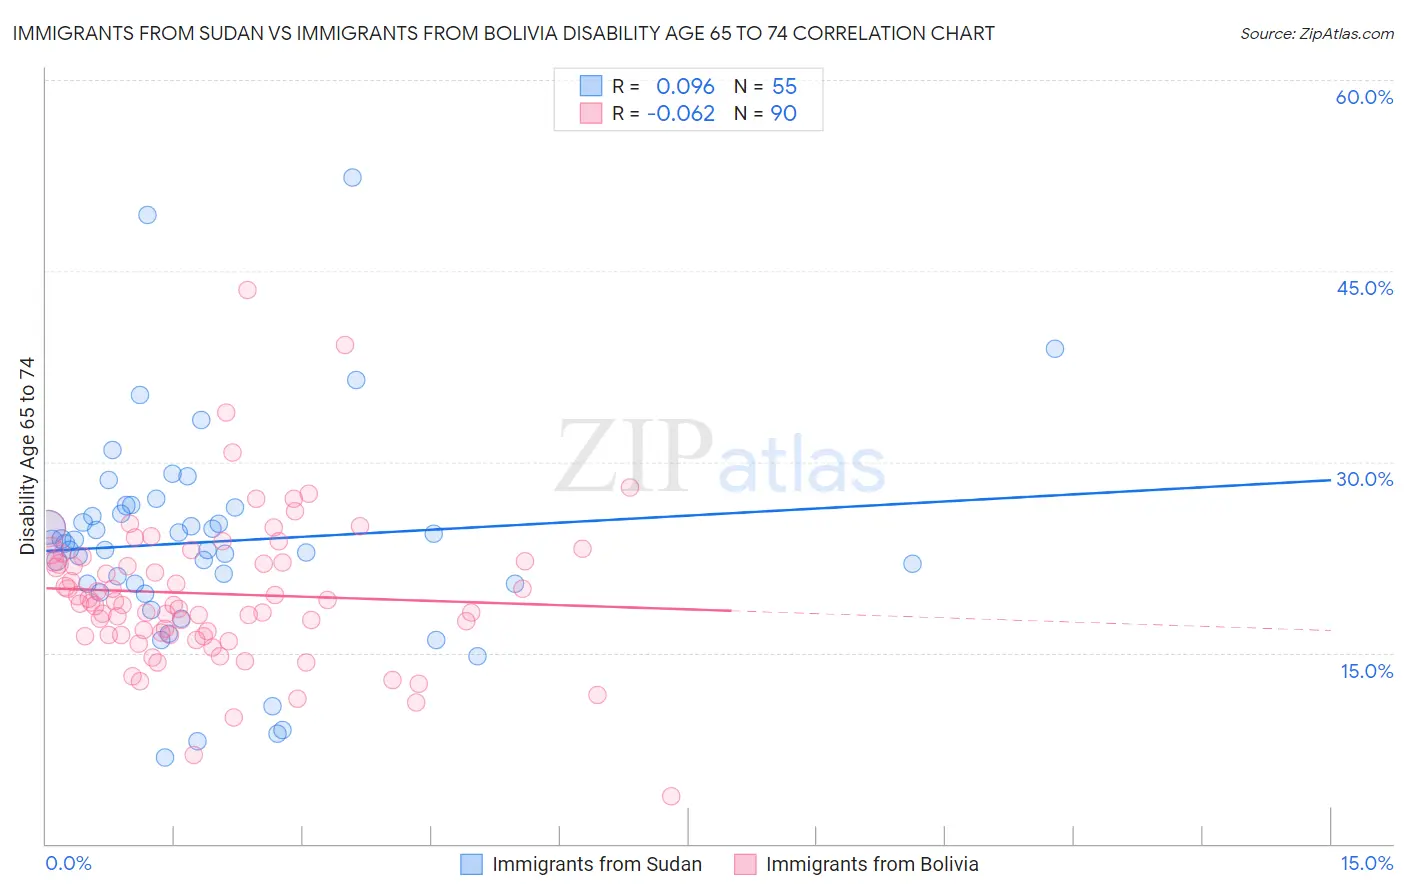
Immigrants from Sudan vs Immigrants from Bolivia Disability Age 65 to 74 Correlation Chart
The statistical analysis conducted on geographies consisting of 118,890,576 people shows a slight positive correlation between the proportion of Immigrants from Sudan and percentage of population with a disability between the ages 65 and 75 in the United States with a correlation coefficient (R) of 0.096 and weighted average of 23.8%. Similarly, the statistical analysis conducted on geographies consisting of 158,677,303 people shows a slight negative correlation between the proportion of Immigrants from Bolivia and percentage of population with a disability between the ages 65 and 75 in the United States with a correlation coefficient (R) of -0.062 and weighted average of 20.8%, a difference of 14.2%.
Disability Age 65 to 74 Correlation Summary
| Measurement | Immigrants from Sudan | Immigrants from Bolivia |
| Minimum | 6.8% | 3.8% |
| Maximum | 52.4% | 43.5% |
| Range | 45.6% | 39.7% |
| Mean | 23.7% | 19.6% |
| Median | 23.6% | 18.9% |
| Interquartile 25% (IQ1) | 20.4% | 16.4% |
| Interquartile 75% (IQ3) | 26.5% | 22.2% |
| Interquartile Range (IQR) | 6.0% | 5.9% |
| Standard Deviation (Sample) | 8.4% | 5.9% |
| Standard Deviation (Population) | 8.4% | 5.8% |
Similar Demographics by Disability Age 65 to 74
Demographics Similar to Immigrants from Sudan by Disability Age 65 to 74
In terms of disability age 65 to 74, the demographic groups most similar to Immigrants from Sudan are Immigrants from Barbados (23.8%, a difference of 0.040%), Immigrants from Kenya (23.8%, a difference of 0.050%), Tongan (23.8%, a difference of 0.060%), Immigrants from Jamaica (23.8%, a difference of 0.060%), and Immigrants from Grenada (23.8%, a difference of 0.17%).
| Demographics | Rating | Rank | Disability Age 65 to 74 |
| French Canadians | 24.0 /100 | #200 | Fair 23.7% |
| Immigrants | Ecuador | 23.9 /100 | #201 | Fair 23.7% |
| Immigrants | Bahamas | 23.3 /100 | #202 | Fair 23.7% |
| Kenyans | 23.2 /100 | #203 | Fair 23.7% |
| Immigrants | Grenada | 22.1 /100 | #204 | Fair 23.8% |
| Tongans | 20.8 /100 | #205 | Fair 23.8% |
| Immigrants | Jamaica | 20.7 /100 | #206 | Fair 23.8% |
| Immigrants | Sudan | 20.1 /100 | #207 | Fair 23.8% |
| Immigrants | Barbados | 19.6 /100 | #208 | Poor 23.8% |
| Immigrants | Kenya | 19.6 /100 | #209 | Poor 23.8% |
| Trinidadians and Tobagonians | 16.4 /100 | #210 | Poor 23.9% |
| Immigrants | West Indies | 15.9 /100 | #211 | Poor 23.9% |
| French | 15.7 /100 | #212 | Poor 23.9% |
| Nicaraguans | 14.3 /100 | #213 | Poor 23.9% |
| Immigrants | Oceania | 13.6 /100 | #214 | Poor 24.0% |
Demographics Similar to Immigrants from Bolivia by Disability Age 65 to 74
In terms of disability age 65 to 74, the demographic groups most similar to Immigrants from Bolivia are Immigrants from Iran (20.9%, a difference of 0.23%), Immigrants from Belgium (21.0%, a difference of 0.53%), Soviet Union (21.0%, a difference of 0.58%), Bolivian (21.0%, a difference of 0.62%), and Immigrants from Australia (21.0%, a difference of 0.64%).
| Demographics | Rating | Rank | Disability Age 65 to 74 |
| Indians (Asian) | 100.0 /100 | #14 | Exceptional 20.5% |
| Paraguayans | 100.0 /100 | #15 | Exceptional 20.5% |
| Immigrants | Lithuania | 100.0 /100 | #16 | Exceptional 20.5% |
| Immigrants | South Central Asia | 100.0 /100 | #17 | Exceptional 20.6% |
| Eastern Europeans | 100.0 /100 | #18 | Exceptional 20.6% |
| Burmese | 100.0 /100 | #19 | Exceptional 20.6% |
| Okinawans | 100.0 /100 | #20 | Exceptional 20.7% |
| Immigrants | Bolivia | 99.9 /100 | #21 | Exceptional 20.8% |
| Immigrants | Iran | 99.9 /100 | #22 | Exceptional 20.9% |
| Immigrants | Belgium | 99.9 /100 | #23 | Exceptional 21.0% |
| Soviet Union | 99.9 /100 | #24 | Exceptional 21.0% |
| Bolivians | 99.9 /100 | #25 | Exceptional 21.0% |
| Immigrants | Australia | 99.9 /100 | #26 | Exceptional 21.0% |
| Immigrants | Sweden | 99.9 /100 | #27 | Exceptional 21.0% |
| Immigrants | Czechoslovakia | 99.9 /100 | #28 | Exceptional 21.0% |