Immigrants from Central America vs Alaskan Athabascan Disability Age 65 to 74
COMPARE
Immigrants from Central America
Alaskan Athabascan
Disability Age 65 to 74
Disability Age 65 to 74 Comparison
Immigrants from Central America
Alaskan Athabascans
26.6%
DISABILITY AGE 65 TO 74
0.0/ 100
METRIC RATING
293rd/ 347
METRIC RANK
32.4%
DISABILITY AGE 65 TO 74
0.0/ 100
METRIC RATING
338th/ 347
METRIC RANK
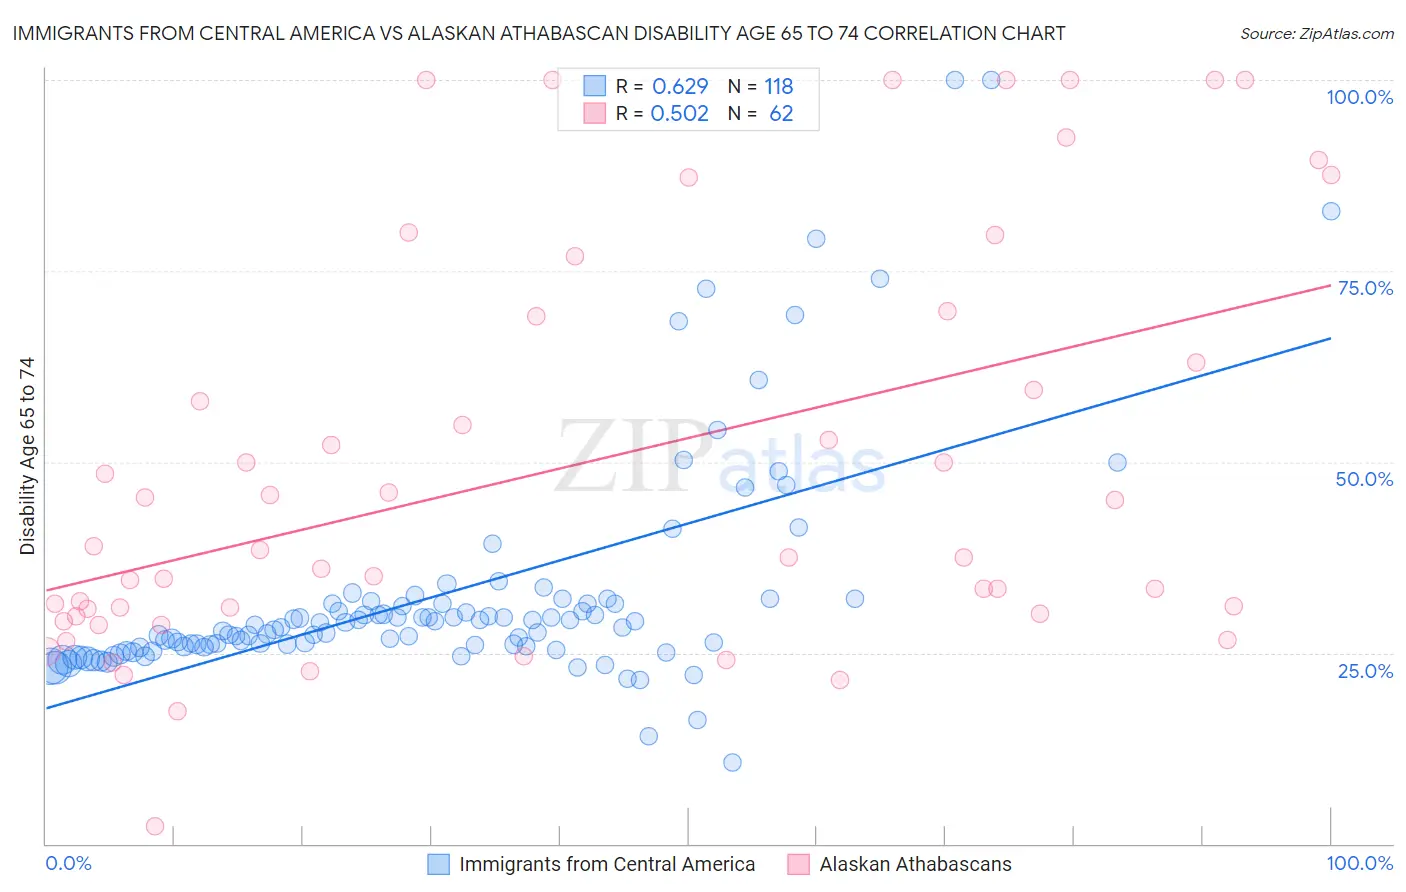
Immigrants from Central America vs Alaskan Athabascan Disability Age 65 to 74 Correlation Chart
The statistical analysis conducted on geographies consisting of 534,691,138 people shows a significant positive correlation between the proportion of Immigrants from Central America and percentage of population with a disability between the ages 65 and 75 in the United States with a correlation coefficient (R) of 0.629 and weighted average of 26.6%. Similarly, the statistical analysis conducted on geographies consisting of 45,797,821 people shows a substantial positive correlation between the proportion of Alaskan Athabascans and percentage of population with a disability between the ages 65 and 75 in the United States with a correlation coefficient (R) of 0.502 and weighted average of 32.4%, a difference of 21.4%.
Disability Age 65 to 74 Correlation Summary
| Measurement | Immigrants from Central America | Alaskan Athabascan |
| Minimum | 10.7% | 2.3% |
| Maximum | 100.0% | 100.0% |
| Range | 89.3% | 97.7% |
| Mean | 32.6% | 49.4% |
| Median | 28.4% | 38.0% |
| Interquartile 25% (IQ1) | 25.8% | 30.1% |
| Interquartile 75% (IQ3) | 31.4% | 69.1% |
| Interquartile Range (IQR) | 5.6% | 39.0% |
| Standard Deviation (Sample) | 15.1% | 26.6% |
| Standard Deviation (Population) | 15.1% | 26.4% |
Similar Demographics by Disability Age 65 to 74
Demographics Similar to Immigrants from Central America by Disability Age 65 to 74
In terms of disability age 65 to 74, the demographic groups most similar to Immigrants from Central America are Dominican (26.7%, a difference of 0.11%), Hispanic or Latino (26.7%, a difference of 0.13%), Blackfeet (26.6%, a difference of 0.16%), Bangladeshi (26.8%, a difference of 0.74%), and Spanish American Indian (26.4%, a difference of 1.0%).
| Demographics | Rating | Rank | Disability Age 65 to 74 |
| Immigrants | Micronesia | 0.0 /100 | #286 | Tragic 26.1% |
| Immigrants | Laos | 0.0 /100 | #287 | Tragic 26.1% |
| Mexican American Indians | 0.0 /100 | #288 | Tragic 26.2% |
| Africans | 0.0 /100 | #289 | Tragic 26.2% |
| Immigrants | Cabo Verde | 0.0 /100 | #290 | Tragic 26.3% |
| Spanish American Indians | 0.0 /100 | #291 | Tragic 26.4% |
| Blackfeet | 0.0 /100 | #292 | Tragic 26.6% |
| Immigrants | Central America | 0.0 /100 | #293 | Tragic 26.6% |
| Dominicans | 0.0 /100 | #294 | Tragic 26.7% |
| Hispanics or Latinos | 0.0 /100 | #295 | Tragic 26.7% |
| Bangladeshis | 0.0 /100 | #296 | Tragic 26.8% |
| Fijians | 0.0 /100 | #297 | Tragic 27.0% |
| Immigrants | Yemen | 0.0 /100 | #298 | Tragic 27.0% |
| Potawatomi | 0.0 /100 | #299 | Tragic 27.0% |
| Immigrants | Dominican Republic | 0.0 /100 | #300 | Tragic 27.0% |
Demographics Similar to Alaskan Athabascans by Disability Age 65 to 74
In terms of disability age 65 to 74, the demographic groups most similar to Alaskan Athabascans are Houma (32.3%, a difference of 0.19%), Kiowa (32.6%, a difference of 0.62%), Lumbee (32.7%, a difference of 1.1%), Tsimshian (32.9%, a difference of 1.7%), and Pueblo (33.1%, a difference of 2.3%).
| Demographics | Rating | Rank | Disability Age 65 to 74 |
| Chickasaw | 0.0 /100 | #331 | Tragic 30.2% |
| Natives/Alaskans | 0.0 /100 | #332 | Tragic 30.4% |
| Colville | 0.0 /100 | #333 | Tragic 30.5% |
| Alaska Natives | 0.0 /100 | #334 | Tragic 30.6% |
| Cheyenne | 0.0 /100 | #335 | Tragic 31.1% |
| Yuman | 0.0 /100 | #336 | Tragic 31.5% |
| Houma | 0.0 /100 | #337 | Tragic 32.3% |
| Alaskan Athabascans | 0.0 /100 | #338 | Tragic 32.4% |
| Kiowa | 0.0 /100 | #339 | Tragic 32.6% |
| Lumbee | 0.0 /100 | #340 | Tragic 32.7% |
| Tsimshian | 0.0 /100 | #341 | Tragic 32.9% |
| Pueblo | 0.0 /100 | #342 | Tragic 33.1% |
| Navajo | 0.0 /100 | #343 | Tragic 33.3% |
| Inupiat | 0.0 /100 | #344 | Tragic 34.5% |
| Tohono O'odham | 0.0 /100 | #345 | Tragic 36.0% |