Immigrants from Sudan vs Iraqi Disability Age 65 to 74
COMPARE
Immigrants from Sudan
Iraqi
Disability Age 65 to 74
Disability Age 65 to 74 Comparison
Immigrants from Sudan
Iraqis
23.8%
DISABILITY AGE 65 TO 74
20.1/ 100
METRIC RATING
207th/ 347
METRIC RANK
24.2%
DISABILITY AGE 65 TO 74
8.1/ 100
METRIC RATING
226th/ 347
METRIC RANK
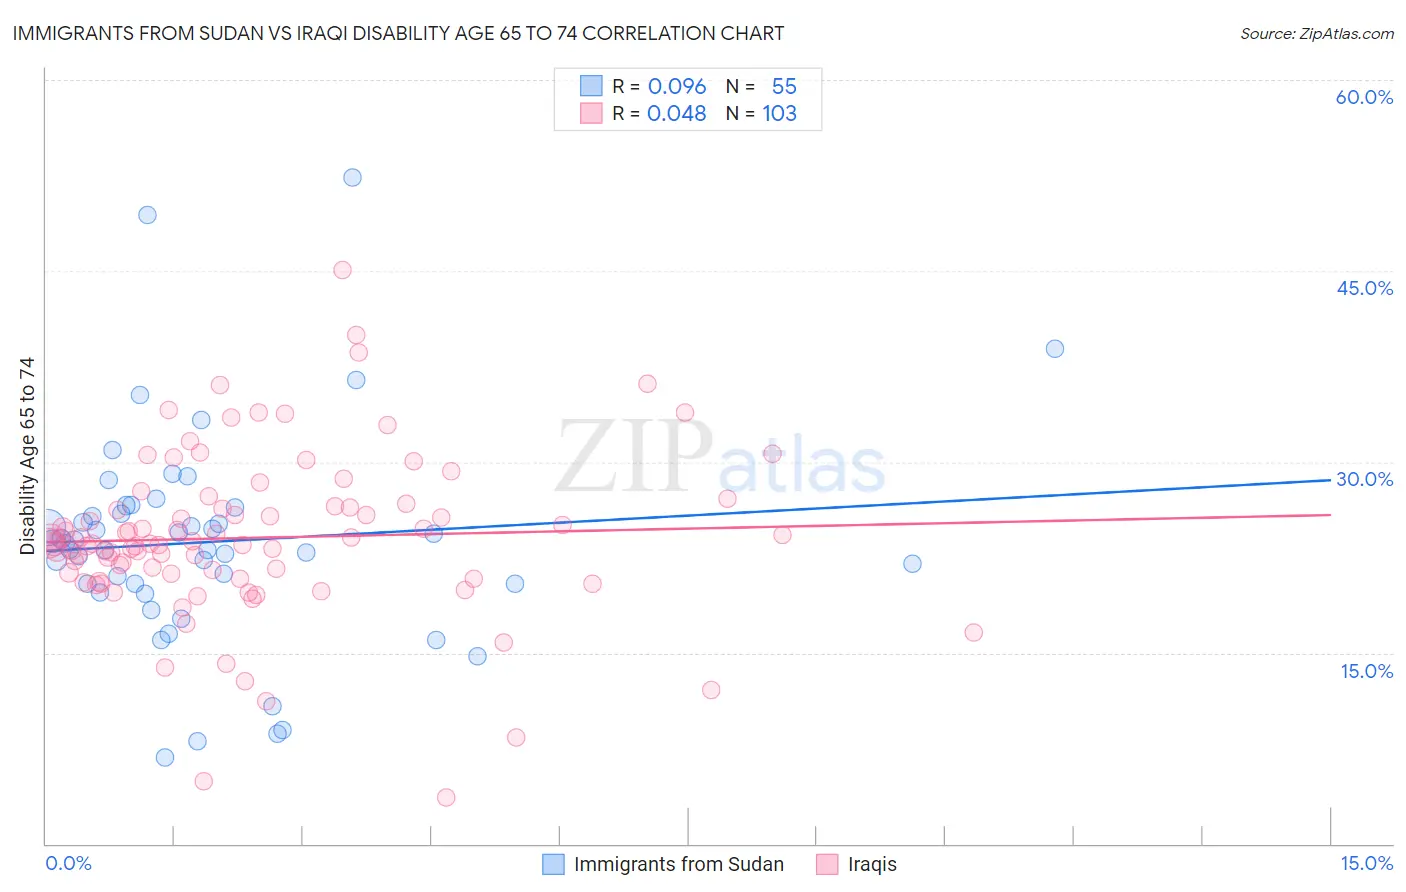
Immigrants from Sudan vs Iraqi Disability Age 65 to 74 Correlation Chart
The statistical analysis conducted on geographies consisting of 118,890,576 people shows a slight positive correlation between the proportion of Immigrants from Sudan and percentage of population with a disability between the ages 65 and 75 in the United States with a correlation coefficient (R) of 0.096 and weighted average of 23.8%. Similarly, the statistical analysis conducted on geographies consisting of 170,539,860 people shows no correlation between the proportion of Iraqis and percentage of population with a disability between the ages 65 and 75 in the United States with a correlation coefficient (R) of 0.048 and weighted average of 24.2%, a difference of 1.5%.
Disability Age 65 to 74 Correlation Summary
| Measurement | Immigrants from Sudan | Iraqi |
| Minimum | 6.8% | 3.6% |
| Maximum | 52.4% | 45.1% |
| Range | 45.6% | 41.5% |
| Mean | 23.7% | 24.0% |
| Median | 23.6% | 23.6% |
| Interquartile 25% (IQ1) | 20.4% | 20.8% |
| Interquartile 75% (IQ3) | 26.5% | 26.5% |
| Interquartile Range (IQR) | 6.0% | 5.6% |
| Standard Deviation (Sample) | 8.4% | 6.5% |
| Standard Deviation (Population) | 8.4% | 6.5% |
Demographics Similar to Immigrants from Sudan and Iraqis by Disability Age 65 to 74
In terms of disability age 65 to 74, the demographic groups most similar to Immigrants from Sudan are Immigrants from Barbados (23.8%, a difference of 0.040%), Immigrants from Kenya (23.8%, a difference of 0.050%), Immigrants from Jamaica (23.8%, a difference of 0.060%), Trinidadian and Tobagonian (23.9%, a difference of 0.35%), and Immigrants from West Indies (23.9%, a difference of 0.40%). Similarly, the demographic groups most similar to Iraqis are Bermudan (24.2%, a difference of 0.010%), Immigrants from Panama (24.1%, a difference of 0.090%), Immigrants from Middle Africa (24.1%, a difference of 0.14%), Native Hawaiian (24.1%, a difference of 0.21%), and Immigrants from Nicaragua (24.1%, a difference of 0.29%).
| Demographics | Rating | Rank | Disability Age 65 to 74 |
| Immigrants | Jamaica | 20.7 /100 | #206 | Fair 23.8% |
| Immigrants | Sudan | 20.1 /100 | #207 | Fair 23.8% |
| Immigrants | Barbados | 19.6 /100 | #208 | Poor 23.8% |
| Immigrants | Kenya | 19.6 /100 | #209 | Poor 23.8% |
| Trinidadians and Tobagonians | 16.4 /100 | #210 | Poor 23.9% |
| Immigrants | West Indies | 15.9 /100 | #211 | Poor 23.9% |
| French | 15.7 /100 | #212 | Poor 23.9% |
| Nicaraguans | 14.3 /100 | #213 | Poor 23.9% |
| Immigrants | Oceania | 13.6 /100 | #214 | Poor 24.0% |
| Pennsylvania Germans | 13.3 /100 | #215 | Poor 24.0% |
| Jamaicans | 12.2 /100 | #216 | Poor 24.0% |
| Immigrants | Portugal | 11.7 /100 | #217 | Poor 24.0% |
| Immigrants | Nigeria | 11.7 /100 | #218 | Poor 24.0% |
| Immigrants | Burma/Myanmar | 11.6 /100 | #219 | Poor 24.0% |
| Ghanaians | 10.4 /100 | #220 | Poor 24.1% |
| Immigrants | Nicaragua | 9.8 /100 | #221 | Tragic 24.1% |
| Native Hawaiians | 9.3 /100 | #222 | Tragic 24.1% |
| Immigrants | Middle Africa | 8.9 /100 | #223 | Tragic 24.1% |
| Immigrants | Panama | 8.6 /100 | #224 | Tragic 24.1% |
| Bermudans | 8.2 /100 | #225 | Tragic 24.2% |
| Iraqis | 8.1 /100 | #226 | Tragic 24.2% |