American vs Alaskan Athabascan Disability Age 65 to 74
COMPARE
American
Alaskan Athabascan
Disability Age 65 to 74
Disability Age 65 to 74 Comparison
Americans
Alaskan Athabascans
25.8%
DISABILITY AGE 65 TO 74
0.1/ 100
METRIC RATING
274th/ 347
METRIC RANK
32.4%
DISABILITY AGE 65 TO 74
0.0/ 100
METRIC RATING
338th/ 347
METRIC RANK
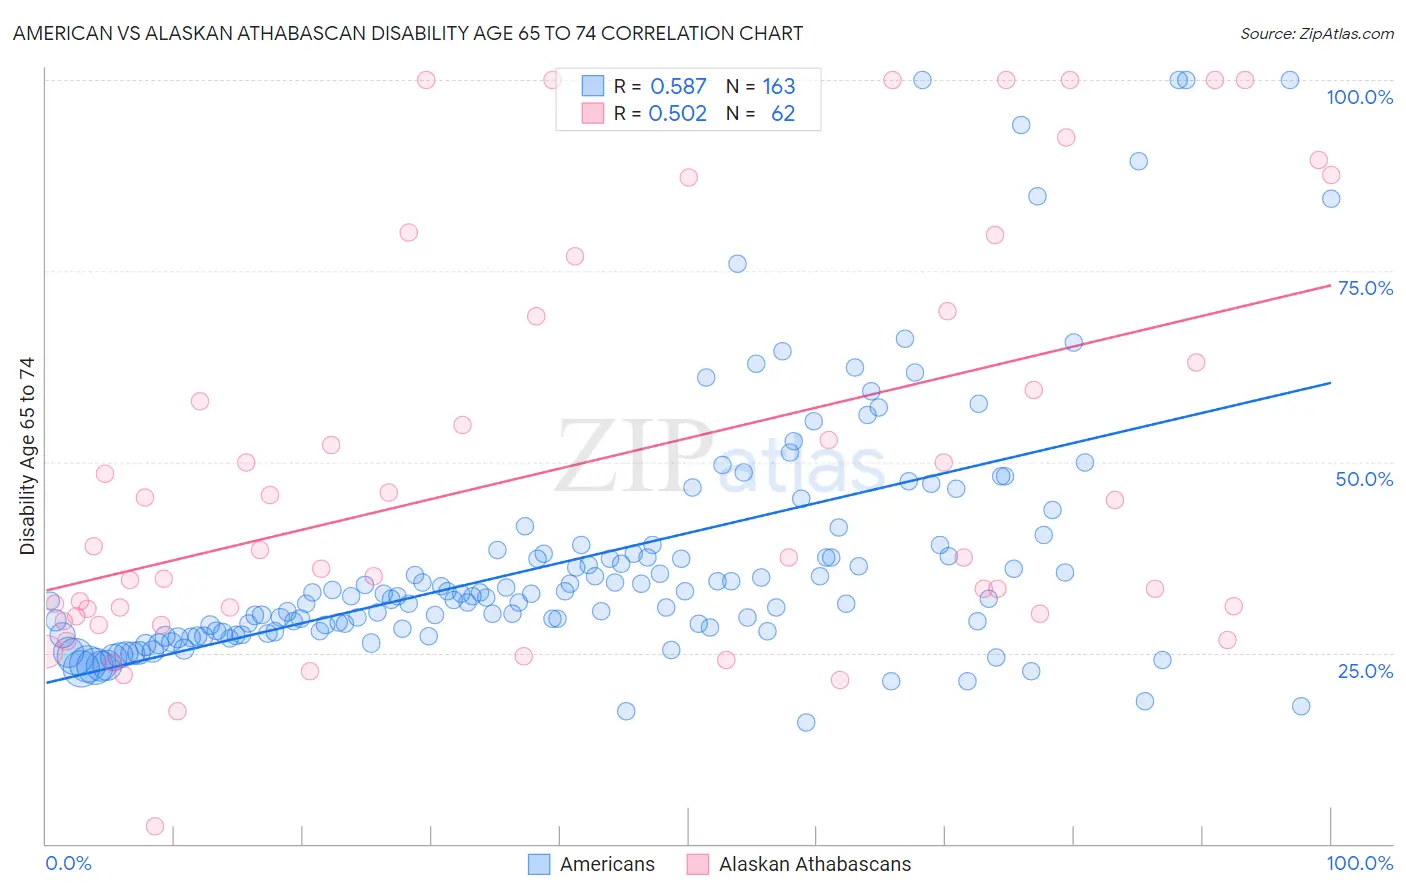
American vs Alaskan Athabascan Disability Age 65 to 74 Correlation Chart
The statistical analysis conducted on geographies consisting of 579,149,624 people shows a substantial positive correlation between the proportion of Americans and percentage of population with a disability between the ages 65 and 75 in the United States with a correlation coefficient (R) of 0.587 and weighted average of 25.8%. Similarly, the statistical analysis conducted on geographies consisting of 45,797,821 people shows a substantial positive correlation between the proportion of Alaskan Athabascans and percentage of population with a disability between the ages 65 and 75 in the United States with a correlation coefficient (R) of 0.502 and weighted average of 32.4%, a difference of 25.4%.
Disability Age 65 to 74 Correlation Summary
| Measurement | American | Alaskan Athabascan |
| Minimum | 15.8% | 2.3% |
| Maximum | 100.0% | 100.0% |
| Range | 84.2% | 97.7% |
| Mean | 37.4% | 49.4% |
| Median | 32.3% | 38.0% |
| Interquartile 25% (IQ1) | 27.8% | 30.1% |
| Interquartile 75% (IQ3) | 38.4% | 69.1% |
| Interquartile Range (IQR) | 10.7% | 39.0% |
| Standard Deviation (Sample) | 16.8% | 26.6% |
| Standard Deviation (Population) | 16.7% | 26.4% |
Similar Demographics by Disability Age 65 to 74
Demographics Similar to Americans by Disability Age 65 to 74
In terms of disability age 65 to 74, the demographic groups most similar to Americans are Honduran (25.8%, a difference of 0.010%), French American Indian (25.8%, a difference of 0.020%), Belizean (25.8%, a difference of 0.11%), Immigrants from Belize (25.8%, a difference of 0.13%), and U.S. Virgin Islander (25.9%, a difference of 0.21%).
| Demographics | Rating | Rank | Disability Age 65 to 74 |
| Ottawa | 0.1 /100 | #267 | Tragic 25.6% |
| Liberians | 0.1 /100 | #268 | Tragic 25.6% |
| Hmong | 0.1 /100 | #269 | Tragic 25.7% |
| Immigrants | Guatemala | 0.1 /100 | #270 | Tragic 25.7% |
| Immigrants | Liberia | 0.1 /100 | #271 | Tragic 25.7% |
| Immigrants | Dominica | 0.1 /100 | #272 | Tragic 25.7% |
| Japanese | 0.1 /100 | #273 | Tragic 25.7% |
| Americans | 0.1 /100 | #274 | Tragic 25.8% |
| Hondurans | 0.1 /100 | #275 | Tragic 25.8% |
| French American Indians | 0.1 /100 | #276 | Tragic 25.8% |
| Belizeans | 0.1 /100 | #277 | Tragic 25.8% |
| Immigrants | Belize | 0.1 /100 | #278 | Tragic 25.8% |
| U.S. Virgin Islanders | 0.1 /100 | #279 | Tragic 25.9% |
| Cree | 0.1 /100 | #280 | Tragic 25.9% |
| Immigrants | Honduras | 0.1 /100 | #281 | Tragic 25.9% |
Demographics Similar to Alaskan Athabascans by Disability Age 65 to 74
In terms of disability age 65 to 74, the demographic groups most similar to Alaskan Athabascans are Houma (32.3%, a difference of 0.19%), Kiowa (32.6%, a difference of 0.62%), Lumbee (32.7%, a difference of 1.1%), Tsimshian (32.9%, a difference of 1.7%), and Pueblo (33.1%, a difference of 2.3%).
| Demographics | Rating | Rank | Disability Age 65 to 74 |
| Chickasaw | 0.0 /100 | #331 | Tragic 30.2% |
| Natives/Alaskans | 0.0 /100 | #332 | Tragic 30.4% |
| Colville | 0.0 /100 | #333 | Tragic 30.5% |
| Alaska Natives | 0.0 /100 | #334 | Tragic 30.6% |
| Cheyenne | 0.0 /100 | #335 | Tragic 31.1% |
| Yuman | 0.0 /100 | #336 | Tragic 31.5% |
| Houma | 0.0 /100 | #337 | Tragic 32.3% |
| Alaskan Athabascans | 0.0 /100 | #338 | Tragic 32.4% |
| Kiowa | 0.0 /100 | #339 | Tragic 32.6% |
| Lumbee | 0.0 /100 | #340 | Tragic 32.7% |
| Tsimshian | 0.0 /100 | #341 | Tragic 32.9% |
| Pueblo | 0.0 /100 | #342 | Tragic 33.1% |
| Navajo | 0.0 /100 | #343 | Tragic 33.3% |
| Inupiat | 0.0 /100 | #344 | Tragic 34.5% |
| Tohono O'odham | 0.0 /100 | #345 | Tragic 36.0% |