Immigrants from Sudan vs Alaskan Athabascan Master's Degree
COMPARE
Immigrants from Sudan
Alaskan Athabascan
Master's Degree
Master's Degree Comparison
Immigrants from Sudan
Alaskan Athabascans
16.0%
MASTER'S DEGREE
90.2/ 100
METRIC RATING
133rd/ 347
METRIC RANK
11.6%
MASTER'S DEGREE
0.1/ 100
METRIC RATING
296th/ 347
METRIC RANK
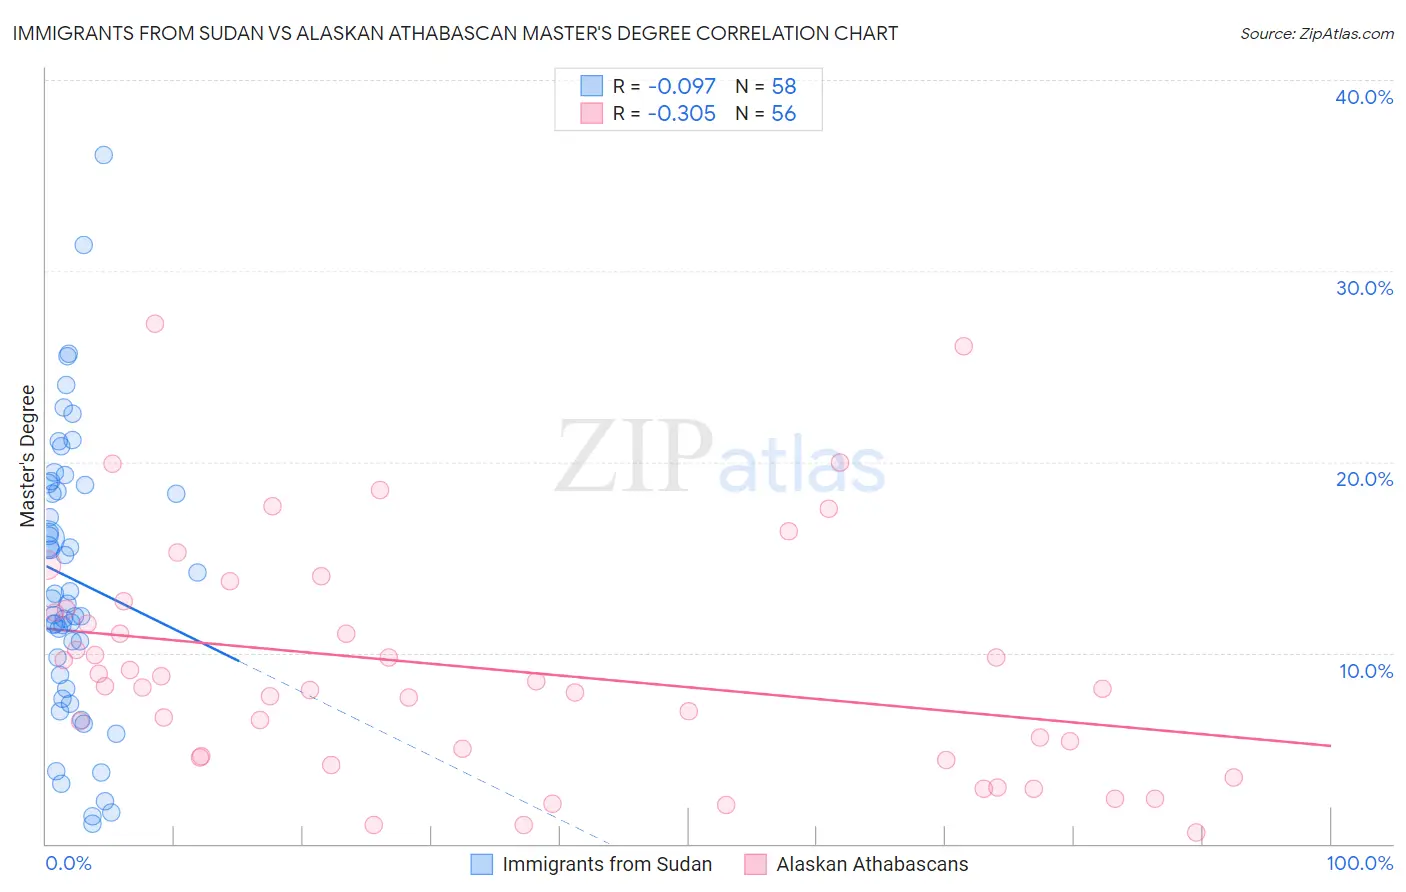
Immigrants from Sudan vs Alaskan Athabascan Master's Degree Correlation Chart
The statistical analysis conducted on geographies consisting of 118,960,679 people shows a slight negative correlation between the proportion of Immigrants from Sudan and percentage of population with at least master's degree education in the United States with a correlation coefficient (R) of -0.097 and weighted average of 16.0%. Similarly, the statistical analysis conducted on geographies consisting of 45,807,187 people shows a mild negative correlation between the proportion of Alaskan Athabascans and percentage of population with at least master's degree education in the United States with a correlation coefficient (R) of -0.305 and weighted average of 11.6%, a difference of 38.1%.
Master's Degree Correlation Summary
| Measurement | Immigrants from Sudan | Alaskan Athabascan |
| Minimum | 1.0% | 0.59% |
| Maximum | 36.1% | 27.2% |
| Range | 35.0% | 26.6% |
| Mean | 13.9% | 9.2% |
| Median | 13.0% | 8.2% |
| Interquartile 25% (IQ1) | 8.8% | 4.6% |
| Interquartile 75% (IQ3) | 18.8% | 12.2% |
| Interquartile Range (IQR) | 10.0% | 7.6% |
| Standard Deviation (Sample) | 7.4% | 6.0% |
| Standard Deviation (Population) | 7.3% | 6.0% |
Similar Demographics by Master's Degree
Demographics Similar to Immigrants from Sudan by Master's Degree
In terms of master's degree, the demographic groups most similar to Immigrants from Sudan are Serbian (16.1%, a difference of 0.54%), Venezuelan (15.9%, a difference of 0.56%), South American Indian (15.9%, a difference of 0.56%), Taiwanese (16.1%, a difference of 0.63%), and Immigrants from Jordan (16.1%, a difference of 0.95%).
| Demographics | Rating | Rank | Master's Degree |
| Immigrants | Eastern Africa | 95.2 /100 | #126 | Exceptional 16.3% |
| Palestinians | 94.8 /100 | #127 | Exceptional 16.3% |
| Immigrants | Sierra Leone | 94.7 /100 | #128 | Exceptional 16.3% |
| Immigrants | Syria | 93.3 /100 | #129 | Exceptional 16.2% |
| Immigrants | Jordan | 92.7 /100 | #130 | Exceptional 16.1% |
| Taiwanese | 91.9 /100 | #131 | Exceptional 16.1% |
| Serbians | 91.7 /100 | #132 | Exceptional 16.1% |
| Immigrants | Sudan | 90.2 /100 | #133 | Exceptional 16.0% |
| Venezuelans | 88.4 /100 | #134 | Excellent 15.9% |
| South American Indians | 88.4 /100 | #135 | Excellent 15.9% |
| Assyrians/Chaldeans/Syriacs | 86.8 /100 | #136 | Excellent 15.8% |
| Europeans | 86.4 /100 | #137 | Excellent 15.8% |
| Pakistanis | 86.1 /100 | #138 | Excellent 15.8% |
| Immigrants | Germany | 85.9 /100 | #139 | Excellent 15.8% |
| Vietnamese | 85.5 /100 | #140 | Excellent 15.8% |
Demographics Similar to Alaskan Athabascans by Master's Degree
In terms of master's degree, the demographic groups most similar to Alaskan Athabascans are Marshallese (11.6%, a difference of 0.010%), Immigrants from Yemen (11.6%, a difference of 0.12%), Hawaiian (11.6%, a difference of 0.16%), Alaska Native (11.6%, a difference of 0.26%), and Immigrants from Guatemala (11.6%, a difference of 0.48%).
| Demographics | Rating | Rank | Master's Degree |
| Guatemalans | 0.1 /100 | #289 | Tragic 11.7% |
| Ute | 0.1 /100 | #290 | Tragic 11.7% |
| Colville | 0.1 /100 | #291 | Tragic 11.6% |
| Immigrants | Guatemala | 0.1 /100 | #292 | Tragic 11.6% |
| Alaska Natives | 0.1 /100 | #293 | Tragic 11.6% |
| Hawaiians | 0.1 /100 | #294 | Tragic 11.6% |
| Marshallese | 0.1 /100 | #295 | Tragic 11.6% |
| Alaskan Athabascans | 0.1 /100 | #296 | Tragic 11.6% |
| Immigrants | Yemen | 0.1 /100 | #297 | Tragic 11.6% |
| Samoans | 0.1 /100 | #298 | Tragic 11.5% |
| Chickasaw | 0.1 /100 | #299 | Tragic 11.4% |
| Chippewa | 0.1 /100 | #300 | Tragic 11.4% |
| Tsimshian | 0.1 /100 | #301 | Tragic 11.4% |
| Cherokee | 0.1 /100 | #302 | Tragic 11.4% |
| Immigrants | Laos | 0.1 /100 | #303 | Tragic 11.4% |