Norwegian vs Immigrants from Western Europe Disability Age 5 to 17
COMPARE
Norwegian
Immigrants from Western Europe
Disability Age 5 to 17
Disability Age 5 to 17 Comparison
Norwegians
Immigrants from Western Europe
5.7%
DISABILITY AGE 5 TO 17
20.9/ 100
METRIC RATING
198th/ 347
METRIC RANK
5.6%
DISABILITY AGE 5 TO 17
47.8/ 100
METRIC RATING
177th/ 347
METRIC RANK
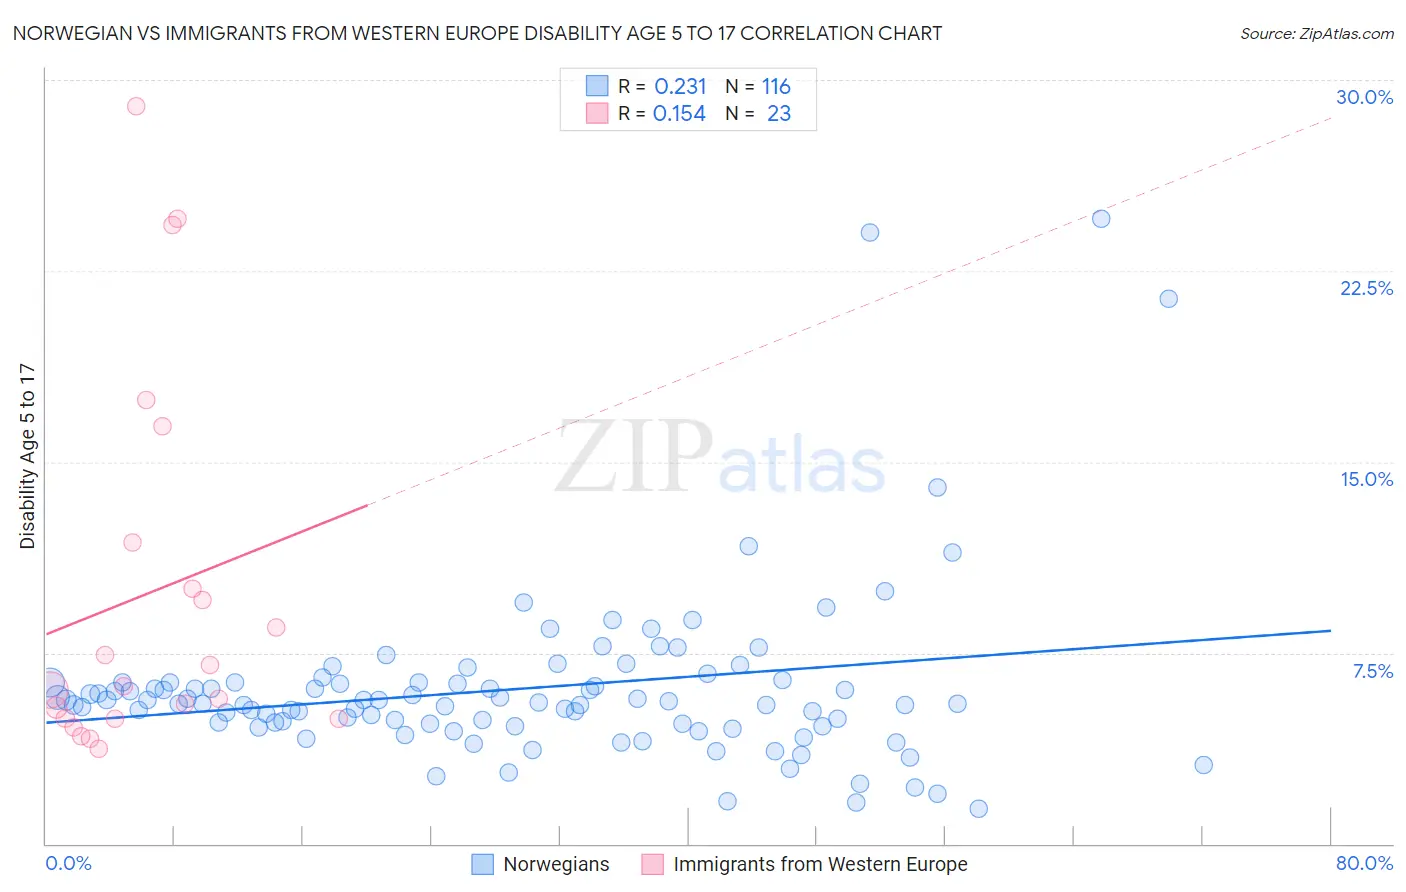
Norwegian vs Immigrants from Western Europe Disability Age 5 to 17 Correlation Chart
The statistical analysis conducted on geographies consisting of 523,039,839 people shows a weak positive correlation between the proportion of Norwegians and percentage of population with a disability between the ages 5 and 17 in the United States with a correlation coefficient (R) of 0.231 and weighted average of 5.7%. Similarly, the statistical analysis conducted on geographies consisting of 487,296,629 people shows a poor positive correlation between the proportion of Immigrants from Western Europe and percentage of population with a disability between the ages 5 and 17 in the United States with a correlation coefficient (R) of 0.154 and weighted average of 5.6%, a difference of 1.5%.
Disability Age 5 to 17 Correlation Summary
| Measurement | Norwegian | Immigrants from Western Europe |
| Minimum | 1.4% | 3.7% |
| Maximum | 24.5% | 29.0% |
| Range | 23.2% | 25.2% |
| Mean | 6.1% | 9.8% |
| Median | 5.5% | 6.2% |
| Interquartile 25% (IQ1) | 4.7% | 4.9% |
| Interquartile 75% (IQ3) | 6.3% | 11.8% |
| Interquartile Range (IQR) | 1.6% | 6.9% |
| Standard Deviation (Sample) | 3.4% | 7.4% |
| Standard Deviation (Population) | 3.4% | 7.2% |
Similar Demographics by Disability Age 5 to 17
Demographics Similar to Norwegians by Disability Age 5 to 17
In terms of disability age 5 to 17, the demographic groups most similar to Norwegians are Immigrants from North America (5.7%, a difference of 0.16%), Inupiat (5.7%, a difference of 0.17%), Immigrants from Nigeria (5.7%, a difference of 0.18%), Croatian (5.7%, a difference of 0.19%), and Immigrants from Canada (5.7%, a difference of 0.35%).
| Demographics | Rating | Rank | Disability Age 5 to 17 |
| Danes | 26.5 /100 | #191 | Fair 5.7% |
| Immigrants | Bosnia and Herzegovina | 26.3 /100 | #192 | Fair 5.7% |
| Immigrants | Canada | 26.1 /100 | #193 | Fair 5.7% |
| Croatians | 23.6 /100 | #194 | Fair 5.7% |
| Immigrants | Nigeria | 23.4 /100 | #195 | Fair 5.7% |
| Inupiat | 23.3 /100 | #196 | Fair 5.7% |
| Immigrants | North America | 23.1 /100 | #197 | Fair 5.7% |
| Norwegians | 20.9 /100 | #198 | Fair 5.7% |
| Northern Europeans | 15.2 /100 | #199 | Poor 5.7% |
| Icelanders | 14.6 /100 | #200 | Poor 5.7% |
| Basques | 13.7 /100 | #201 | Poor 5.7% |
| Austrians | 13.2 /100 | #202 | Poor 5.7% |
| Spanish American Indians | 12.8 /100 | #203 | Poor 5.7% |
| Paiute | 11.2 /100 | #204 | Poor 5.7% |
| Trinidadians and Tobagonians | 10.8 /100 | #205 | Poor 5.7% |
Demographics Similar to Immigrants from Western Europe by Disability Age 5 to 17
In terms of disability age 5 to 17, the demographic groups most similar to Immigrants from Western Europe are Immigrants from Trinidad and Tobago (5.6%, a difference of 0.010%), Shoshone (5.6%, a difference of 0.080%), Immigrants from Central America (5.6%, a difference of 0.080%), Costa Rican (5.6%, a difference of 0.11%), and Uruguayan (5.6%, a difference of 0.16%).
| Demographics | Rating | Rank | Disability Age 5 to 17 |
| Serbians | 54.0 /100 | #170 | Average 5.6% |
| Immigrants | Iraq | 53.9 /100 | #171 | Average 5.6% |
| Ukrainians | 51.5 /100 | #172 | Average 5.6% |
| Uruguayans | 51.0 /100 | #173 | Average 5.6% |
| Costa Ricans | 50.0 /100 | #174 | Average 5.6% |
| Shoshone | 49.4 /100 | #175 | Average 5.6% |
| Immigrants | Central America | 49.4 /100 | #176 | Average 5.6% |
| Immigrants | Western Europe | 47.8 /100 | #177 | Average 5.6% |
| Immigrants | Trinidad and Tobago | 47.6 /100 | #178 | Average 5.6% |
| Immigrants | Barbados | 40.5 /100 | #179 | Average 5.6% |
| Immigrants | Uruguay | 37.7 /100 | #180 | Fair 5.6% |
| Immigrants | England | 36.4 /100 | #181 | Fair 5.6% |
| Mexican American Indians | 35.2 /100 | #182 | Fair 5.6% |
| Immigrants | Latin America | 34.3 /100 | #183 | Fair 5.6% |
| Syrians | 33.8 /100 | #184 | Fair 5.6% |