Immigrants from St. Vincent and the Grenadines vs Creek Self-Care Disability
COMPARE
Immigrants from St. Vincent and the Grenadines
Creek
Self-Care Disability
Self-Care Disability Comparison
Immigrants from St. Vincent and the Grenadines
Creek
2.8%
SELF-CARE DISABILITY
0.0/ 100
METRIC RATING
302nd/ 347
METRIC RANK
2.8%
SELF-CARE DISABILITY
0.0/ 100
METRIC RATING
314th/ 347
METRIC RANK
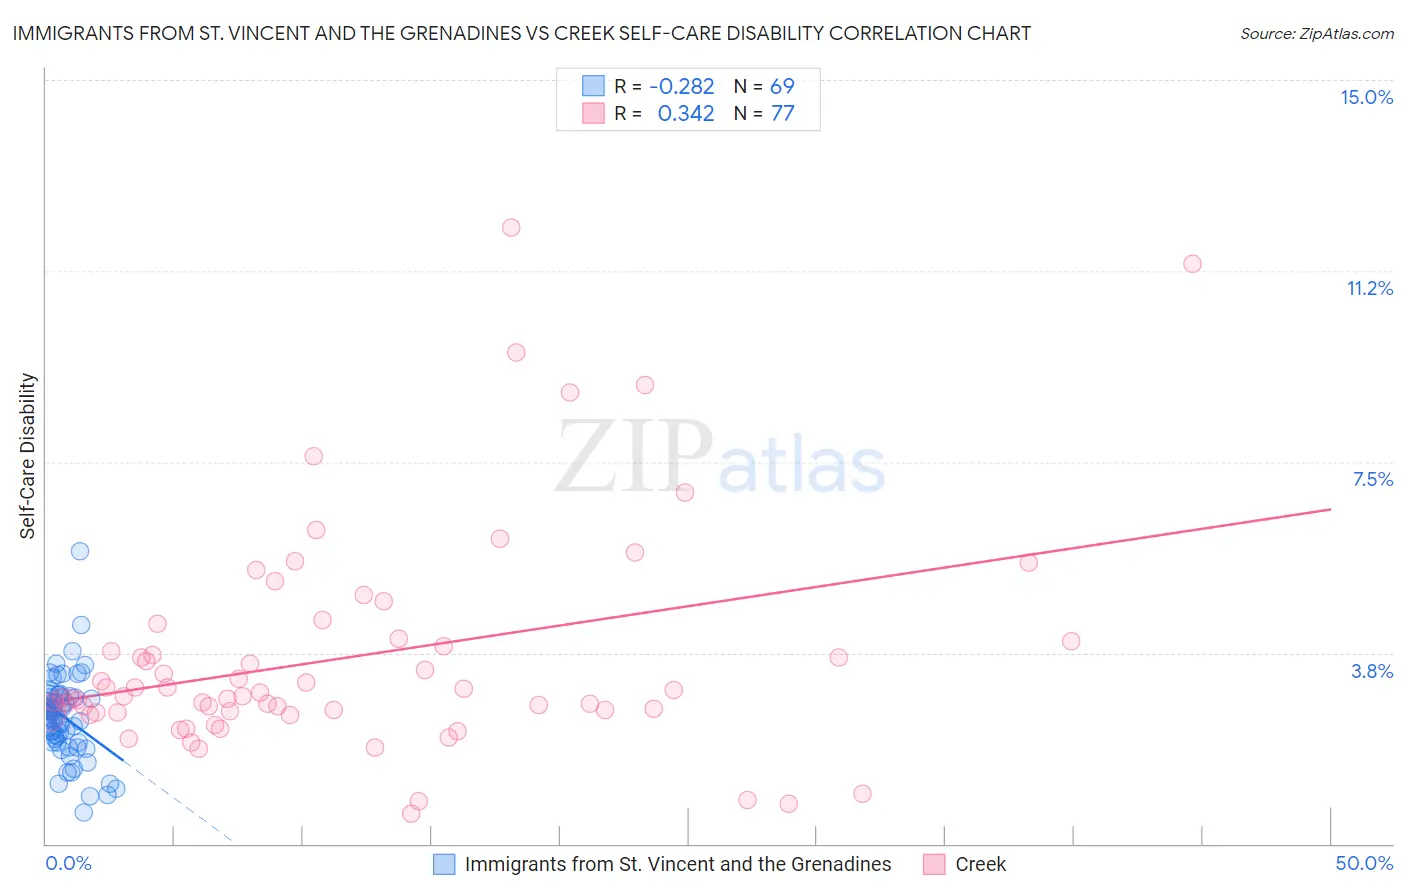
Immigrants from St. Vincent and the Grenadines vs Creek Self-Care Disability Correlation Chart
The statistical analysis conducted on geographies consisting of 56,160,943 people shows a weak negative correlation between the proportion of Immigrants from St. Vincent and the Grenadines and percentage of population with self-care disability in the United States with a correlation coefficient (R) of -0.282 and weighted average of 2.8%. Similarly, the statistical analysis conducted on geographies consisting of 178,379,870 people shows a mild positive correlation between the proportion of Creek and percentage of population with self-care disability in the United States with a correlation coefficient (R) of 0.342 and weighted average of 2.8%, a difference of 1.9%.
Self-Care Disability Correlation Summary
| Measurement | Immigrants from St. Vincent and the Grenadines | Creek |
| Minimum | 0.61% | 0.58% |
| Maximum | 5.7% | 12.1% |
| Range | 5.1% | 11.5% |
| Mean | 2.5% | 3.7% |
| Median | 2.5% | 2.9% |
| Interquartile 25% (IQ1) | 2.0% | 2.6% |
| Interquartile 75% (IQ3) | 2.9% | 4.0% |
| Interquartile Range (IQR) | 0.89% | 1.4% |
| Standard Deviation (Sample) | 0.82% | 2.2% |
| Standard Deviation (Population) | 0.82% | 2.2% |
Demographics Similar to Immigrants from St. Vincent and the Grenadines and Creek by Self-Care Disability
In terms of self-care disability, the demographic groups most similar to Immigrants from St. Vincent and the Grenadines are Pima (2.8%, a difference of 0.040%), Immigrants from Fiji (2.8%, a difference of 0.13%), Immigrants from Belize (2.8%, a difference of 0.15%), Cree (2.8%, a difference of 0.30%), and Immigrants from West Indies (2.8%, a difference of 0.35%). Similarly, the demographic groups most similar to Creek are Immigrants from Cuba (2.8%, a difference of 0.21%), Spanish American (2.8%, a difference of 0.22%), Immigrants from Caribbean (2.8%, a difference of 0.25%), Menominee (2.8%, a difference of 0.32%), and Immigrants from Dominica (2.8%, a difference of 0.44%).
| Demographics | Rating | Rank | Self-Care Disability |
| Americans | 0.0 /100 | #298 | Tragic 2.8% |
| Immigrants | Guyana | 0.0 /100 | #299 | Tragic 2.8% |
| Immigrants | Fiji | 0.0 /100 | #300 | Tragic 2.8% |
| Pima | 0.0 /100 | #301 | Tragic 2.8% |
| Immigrants | St. Vincent and the Grenadines | 0.0 /100 | #302 | Tragic 2.8% |
| Immigrants | Belize | 0.0 /100 | #303 | Tragic 2.8% |
| Cree | 0.0 /100 | #304 | Tragic 2.8% |
| Immigrants | West Indies | 0.0 /100 | #305 | Tragic 2.8% |
| Aleuts | 0.0 /100 | #306 | Tragic 2.8% |
| Natives/Alaskans | 0.0 /100 | #307 | Tragic 2.8% |
| Immigrants | Grenada | 0.0 /100 | #308 | Tragic 2.8% |
| Bangladeshis | 0.0 /100 | #309 | Tragic 2.8% |
| British West Indians | 0.0 /100 | #310 | Tragic 2.8% |
| Puget Sound Salish | 0.0 /100 | #311 | Tragic 2.8% |
| Immigrants | Caribbean | 0.0 /100 | #312 | Tragic 2.8% |
| Spanish Americans | 0.0 /100 | #313 | Tragic 2.8% |
| Creek | 0.0 /100 | #314 | Tragic 2.8% |
| Immigrants | Cuba | 0.0 /100 | #315 | Tragic 2.8% |
| Menominee | 0.0 /100 | #316 | Tragic 2.8% |
| Immigrants | Dominica | 0.0 /100 | #317 | Tragic 2.8% |
| Assyrians/Chaldeans/Syriacs | 0.0 /100 | #318 | Tragic 2.8% |