Immigrants from South Africa vs Immigrants from Thailand Self-Care Disability
COMPARE
Immigrants from South Africa
Immigrants from Thailand
Self-Care Disability
Self-Care Disability Comparison
Immigrants from South Africa
Immigrants from Thailand
2.3%
SELF-CARE DISABILITY
99.8/ 100
METRIC RATING
44th/ 347
METRIC RANK
2.6%
SELF-CARE DISABILITY
4.5/ 100
METRIC RATING
215th/ 347
METRIC RANK
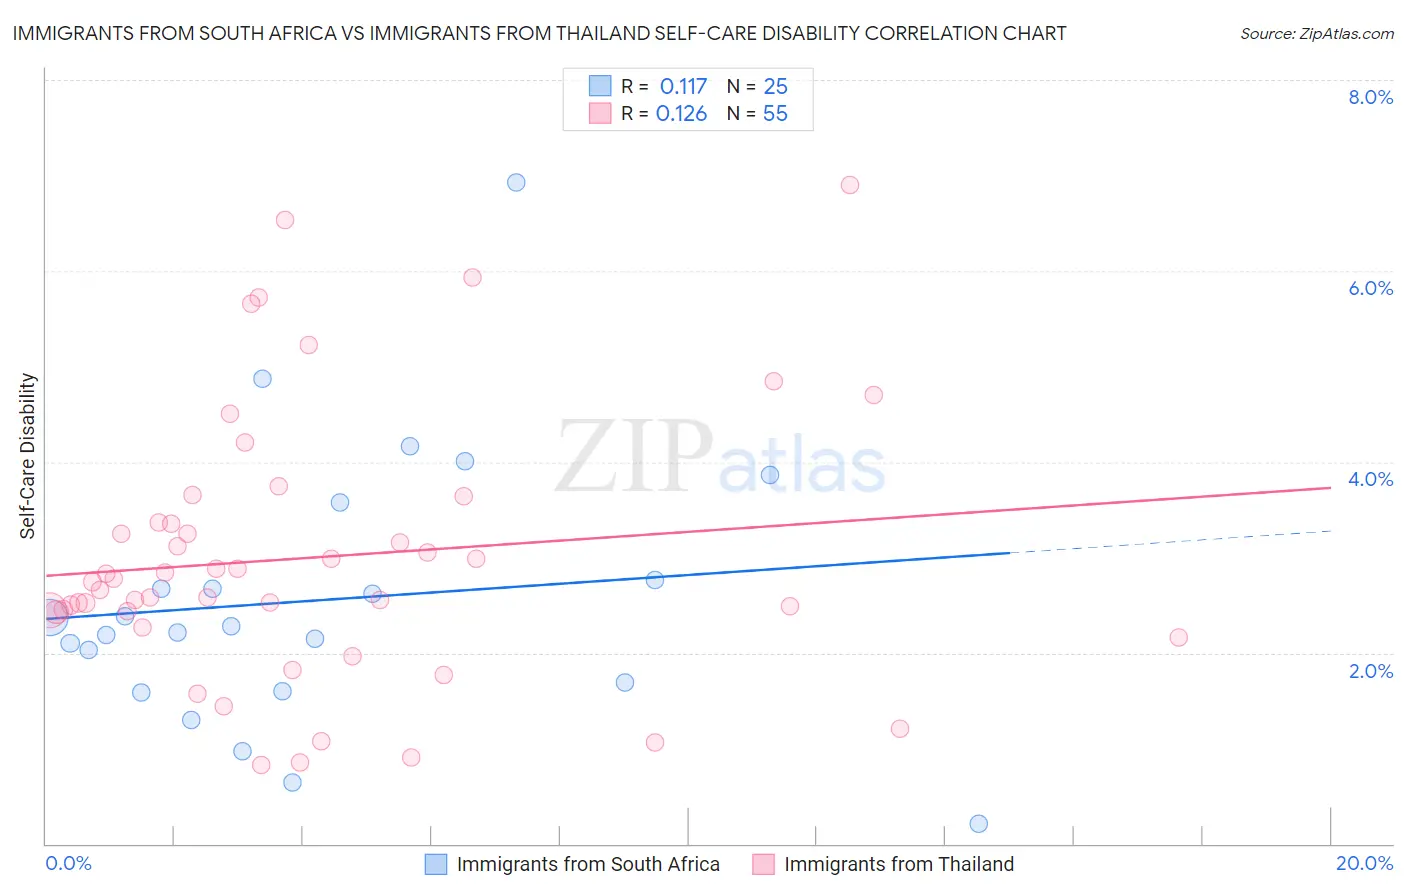
Immigrants from South Africa vs Immigrants from Thailand Self-Care Disability Correlation Chart
The statistical analysis conducted on geographies consisting of 233,197,729 people shows a poor positive correlation between the proportion of Immigrants from South Africa and percentage of population with self-care disability in the United States with a correlation coefficient (R) of 0.117 and weighted average of 2.3%. Similarly, the statistical analysis conducted on geographies consisting of 316,791,227 people shows a poor positive correlation between the proportion of Immigrants from Thailand and percentage of population with self-care disability in the United States with a correlation coefficient (R) of 0.126 and weighted average of 2.6%, a difference of 11.9%.
Self-Care Disability Correlation Summary
| Measurement | Immigrants from South Africa | Immigrants from Thailand |
| Minimum | 0.21% | 0.83% |
| Maximum | 6.9% | 6.9% |
| Range | 6.7% | 6.1% |
| Mean | 2.6% | 3.0% |
| Median | 2.3% | 2.7% |
| Interquartile 25% (IQ1) | 1.6% | 2.4% |
| Interquartile 75% (IQ3) | 3.2% | 3.4% |
| Interquartile Range (IQR) | 1.5% | 0.94% |
| Standard Deviation (Sample) | 1.4% | 1.4% |
| Standard Deviation (Population) | 1.4% | 1.4% |
Similar Demographics by Self-Care Disability
Demographics Similar to Immigrants from South Africa by Self-Care Disability
In terms of self-care disability, the demographic groups most similar to Immigrants from South Africa are Immigrants from Pakistan (2.3%, a difference of 0.040%), Norwegian (2.3%, a difference of 0.040%), Immigrants from Uganda (2.3%, a difference of 0.090%), Czech (2.3%, a difference of 0.13%), and Immigrants from Sudan (2.3%, a difference of 0.19%).
| Demographics | Rating | Rank | Self-Care Disability |
| Immigrants | Sweden | 99.9 /100 | #37 | Exceptional 2.3% |
| Immigrants | Eastern Africa | 99.9 /100 | #38 | Exceptional 2.3% |
| Immigrants | Bulgaria | 99.8 /100 | #39 | Exceptional 2.3% |
| Iranians | 99.8 /100 | #40 | Exceptional 2.3% |
| Immigrants | Sudan | 99.8 /100 | #41 | Exceptional 2.3% |
| Immigrants | Uganda | 99.8 /100 | #42 | Exceptional 2.3% |
| Immigrants | Pakistan | 99.8 /100 | #43 | Exceptional 2.3% |
| Immigrants | South Africa | 99.8 /100 | #44 | Exceptional 2.3% |
| Norwegians | 99.8 /100 | #45 | Exceptional 2.3% |
| Czechs | 99.8 /100 | #46 | Exceptional 2.3% |
| Jordanians | 99.7 /100 | #47 | Exceptional 2.3% |
| Immigrants | Malaysia | 99.7 /100 | #48 | Exceptional 2.3% |
| Latvians | 99.7 /100 | #49 | Exceptional 2.3% |
| Immigrants | Brazil | 99.7 /100 | #50 | Exceptional 2.3% |
| Kenyans | 99.7 /100 | #51 | Exceptional 2.3% |
Demographics Similar to Immigrants from Thailand by Self-Care Disability
In terms of self-care disability, the demographic groups most similar to Immigrants from Thailand are White/Caucasian (2.6%, a difference of 0.020%), Immigrants from Honduras (2.6%, a difference of 0.040%), Celtic (2.6%, a difference of 0.040%), Ecuadorian (2.6%, a difference of 0.050%), and Scotch-Irish (2.6%, a difference of 0.11%).
| Demographics | Rating | Rank | Self-Care Disability |
| Central Americans | 8.7 /100 | #208 | Tragic 2.5% |
| Malaysians | 7.7 /100 | #209 | Tragic 2.5% |
| Panamanians | 6.4 /100 | #210 | Tragic 2.5% |
| Native Hawaiians | 5.1 /100 | #211 | Tragic 2.6% |
| Samoans | 5.1 /100 | #212 | Tragic 2.6% |
| Ecuadorians | 4.7 /100 | #213 | Tragic 2.6% |
| Immigrants | Honduras | 4.7 /100 | #214 | Tragic 2.6% |
| Immigrants | Thailand | 4.5 /100 | #215 | Tragic 2.6% |
| Whites/Caucasians | 4.4 /100 | #216 | Tragic 2.6% |
| Celtics | 4.4 /100 | #217 | Tragic 2.6% |
| Scotch-Irish | 4.1 /100 | #218 | Tragic 2.6% |
| Immigrants | Moldova | 4.0 /100 | #219 | Tragic 2.6% |
| Sub-Saharan Africans | 4.0 /100 | #220 | Tragic 2.6% |
| Hondurans | 3.8 /100 | #221 | Tragic 2.6% |
| Spaniards | 3.8 /100 | #222 | Tragic 2.6% |