Immigrants from South Africa vs Immigrants from Thailand Unemployment Among Women with Children Under 6 years
COMPARE
Immigrants from South Africa
Immigrants from Thailand
Unemployment Among Women with Children Under 6 years
Unemployment Among Women with Children Under 6 years Comparison
Immigrants from South Africa
Immigrants from Thailand
7.3%
UNEMPLOYMENT AMONG WOMEN WITH CHILDREN UNDER 6 YEARS
92.5/ 100
METRIC RATING
124th/ 347
METRIC RANK
7.7%
UNEMPLOYMENT AMONG WOMEN WITH CHILDREN UNDER 6 YEARS
38.5/ 100
METRIC RATING
187th/ 347
METRIC RANK
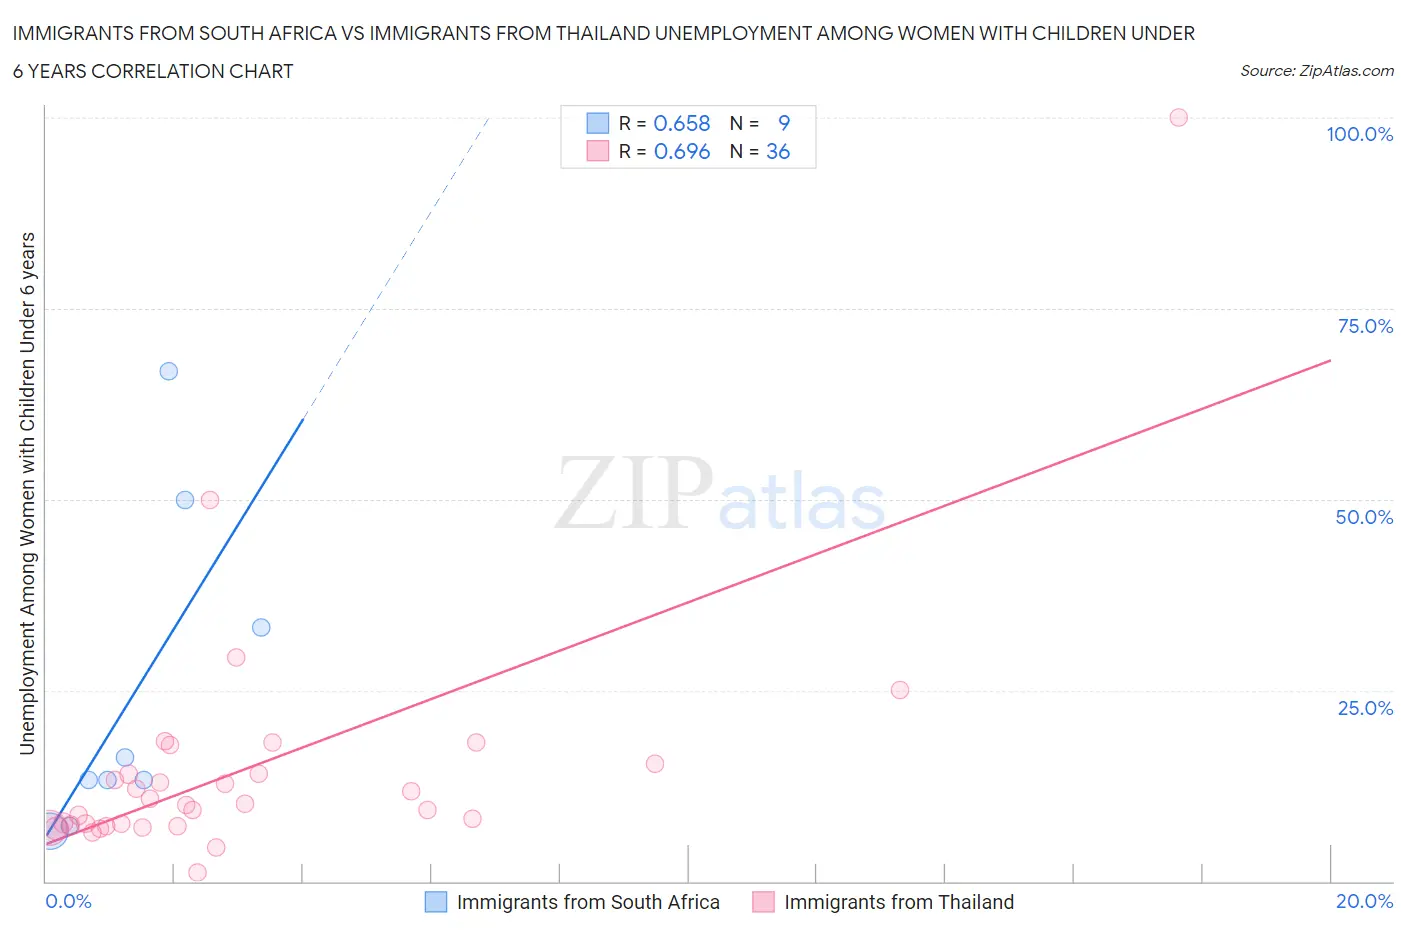
Immigrants from South Africa vs Immigrants from Thailand Unemployment Among Women with Children Under 6 years Correlation Chart
The statistical analysis conducted on geographies consisting of 190,041,875 people shows a significant positive correlation between the proportion of Immigrants from South Africa and unemployment rate among women with children under the age of 6 in the United States with a correlation coefficient (R) of 0.658 and weighted average of 7.3%. Similarly, the statistical analysis conducted on geographies consisting of 254,495,229 people shows a significant positive correlation between the proportion of Immigrants from Thailand and unemployment rate among women with children under the age of 6 in the United States with a correlation coefficient (R) of 0.696 and weighted average of 7.7%, a difference of 5.2%.
Unemployment Among Women with Children Under 6 years Correlation Summary
| Measurement | Immigrants from South Africa | Immigrants from Thailand |
| Minimum | 6.6% | 1.1% |
| Maximum | 66.7% | 100.0% |
| Range | 60.1% | 98.9% |
| Mean | 24.4% | 14.8% |
| Median | 13.3% | 10.0% |
| Interquartile 25% (IQ1) | 10.3% | 7.2% |
| Interquartile 75% (IQ3) | 41.6% | 14.7% |
| Interquartile Range (IQR) | 31.4% | 7.5% |
| Standard Deviation (Sample) | 21.1% | 16.9% |
| Standard Deviation (Population) | 19.9% | 16.7% |
Similar Demographics by Unemployment Among Women with Children Under 6 years
Demographics Similar to Immigrants from South Africa by Unemployment Among Women with Children Under 6 years
In terms of unemployment among women with children under 6 years, the demographic groups most similar to Immigrants from South Africa are Pakistani (7.3%, a difference of 0.080%), Immigrants from Burma/Myanmar (7.3%, a difference of 0.15%), Immigrants from Zaire (7.3%, a difference of 0.20%), Immigrants from Bosnia and Herzegovina (7.3%, a difference of 0.25%), and Jordanian (7.3%, a difference of 0.25%).
| Demographics | Rating | Rank | Unemployment Among Women with Children Under 6 years |
| Immigrants | Kenya | 95.4 /100 | #117 | Exceptional 7.3% |
| Serbians | 94.5 /100 | #118 | Exceptional 7.3% |
| South Africans | 94.1 /100 | #119 | Exceptional 7.3% |
| Iraqis | 93.9 /100 | #120 | Exceptional 7.3% |
| Immigrants | Chile | 93.5 /100 | #121 | Exceptional 7.3% |
| Immigrants | Bosnia and Herzegovina | 93.5 /100 | #122 | Exceptional 7.3% |
| Immigrants | Zaire | 93.3 /100 | #123 | Exceptional 7.3% |
| Immigrants | South Africa | 92.5 /100 | #124 | Exceptional 7.3% |
| Pakistanis | 92.2 /100 | #125 | Exceptional 7.3% |
| Immigrants | Burma/Myanmar | 91.9 /100 | #126 | Exceptional 7.3% |
| Jordanians | 91.5 /100 | #127 | Exceptional 7.3% |
| Zimbabweans | 91.5 /100 | #128 | Exceptional 7.3% |
| Slovenes | 89.2 /100 | #129 | Excellent 7.4% |
| Swedes | 88.4 /100 | #130 | Excellent 7.4% |
| Ukrainians | 88.2 /100 | #131 | Excellent 7.4% |
Demographics Similar to Immigrants from Thailand by Unemployment Among Women with Children Under 6 years
In terms of unemployment among women with children under 6 years, the demographic groups most similar to Immigrants from Thailand are Czechoslovakian (7.7%, a difference of 0.010%), Yugoslavian (7.7%, a difference of 0.060%), Spanish American (7.7%, a difference of 0.080%), Indonesian (7.7%, a difference of 0.14%), and Immigrants from Panama (7.7%, a difference of 0.20%).
| Demographics | Rating | Rank | Unemployment Among Women with Children Under 6 years |
| Immigrants | Uruguay | 44.5 /100 | #180 | Average 7.7% |
| Brazilians | 43.9 /100 | #181 | Average 7.7% |
| Nepalese | 43.5 /100 | #182 | Average 7.7% |
| Sierra Leoneans | 42.9 /100 | #183 | Average 7.7% |
| Indonesians | 40.5 /100 | #184 | Average 7.7% |
| Spanish Americans | 39.7 /100 | #185 | Fair 7.7% |
| Yugoslavians | 39.4 /100 | #186 | Fair 7.7% |
| Immigrants | Thailand | 38.5 /100 | #187 | Fair 7.7% |
| Czechoslovakians | 38.4 /100 | #188 | Fair 7.7% |
| Immigrants | Panama | 35.7 /100 | #189 | Fair 7.7% |
| Immigrants | North Macedonia | 34.4 /100 | #190 | Fair 7.7% |
| Immigrants | Austria | 32.4 /100 | #191 | Fair 7.7% |
| Immigrants | Africa | 32.4 /100 | #192 | Fair 7.7% |
| Slavs | 32.4 /100 | #193 | Fair 7.7% |
| Syrians | 31.9 /100 | #194 | Fair 7.7% |