Immigrants from Somalia vs Immigrants from Portugal Disability Age 5 to 17
COMPARE
Immigrants from Somalia
Immigrants from Portugal
Disability Age 5 to 17
Disability Age 5 to 17 Comparison
Immigrants from Somalia
Immigrants from Portugal
6.0%
DISABILITY AGE 5 TO 17
0.4/ 100
METRIC RATING
270th/ 347
METRIC RANK
6.4%
DISABILITY AGE 5 TO 17
0.0/ 100
METRIC RATING
315th/ 347
METRIC RANK
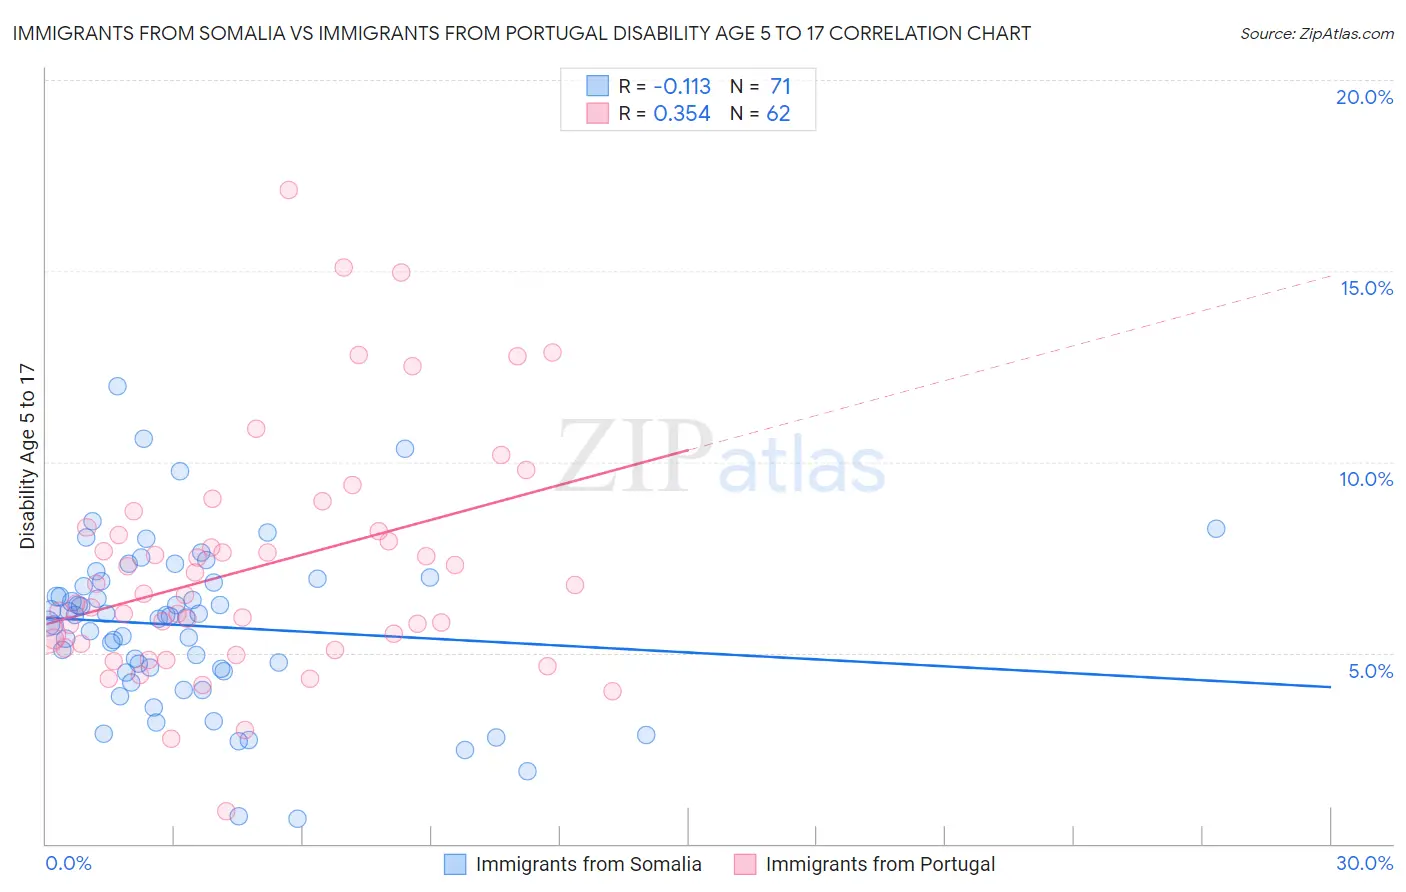
Immigrants from Somalia vs Immigrants from Portugal Disability Age 5 to 17 Correlation Chart
The statistical analysis conducted on geographies consisting of 92,029,922 people shows a poor negative correlation between the proportion of Immigrants from Somalia and percentage of population with a disability between the ages 5 and 17 in the United States with a correlation coefficient (R) of -0.113 and weighted average of 6.0%. Similarly, the statistical analysis conducted on geographies consisting of 173,811,905 people shows a mild positive correlation between the proportion of Immigrants from Portugal and percentage of population with a disability between the ages 5 and 17 in the United States with a correlation coefficient (R) of 0.354 and weighted average of 6.4%, a difference of 7.3%.
Disability Age 5 to 17 Correlation Summary
| Measurement | Immigrants from Somalia | Immigrants from Portugal |
| Minimum | 0.64% | 0.84% |
| Maximum | 12.0% | 17.1% |
| Range | 11.3% | 16.3% |
| Mean | 5.7% | 7.2% |
| Median | 6.0% | 6.5% |
| Interquartile 25% (IQ1) | 4.5% | 5.3% |
| Interquartile 75% (IQ3) | 6.9% | 8.2% |
| Interquartile Range (IQR) | 2.4% | 2.9% |
| Standard Deviation (Sample) | 2.1% | 3.1% |
| Standard Deviation (Population) | 2.1% | 3.1% |
Similar Demographics by Disability Age 5 to 17
Demographics Similar to Immigrants from Somalia by Disability Age 5 to 17
In terms of disability age 5 to 17, the demographic groups most similar to Immigrants from Somalia are Liberian (6.0%, a difference of 0.19%), Sioux (6.0%, a difference of 0.22%), Spanish (6.0%, a difference of 0.41%), Slovene (6.0%, a difference of 0.52%), and Panamanian (6.0%, a difference of 0.55%).
| Demographics | Rating | Rank | Disability Age 5 to 17 |
| Czechoslovakians | 0.7 /100 | #263 | Tragic 5.9% |
| Canadians | 0.6 /100 | #264 | Tragic 6.0% |
| Panamanians | 0.6 /100 | #265 | Tragic 6.0% |
| Slovenes | 0.6 /100 | #266 | Tragic 6.0% |
| Spanish | 0.5 /100 | #267 | Tragic 6.0% |
| Sioux | 0.4 /100 | #268 | Tragic 6.0% |
| Liberians | 0.4 /100 | #269 | Tragic 6.0% |
| Immigrants | Somalia | 0.4 /100 | #270 | Tragic 6.0% |
| Immigrants | Zaire | 0.2 /100 | #271 | Tragic 6.0% |
| Finns | 0.2 /100 | #272 | Tragic 6.0% |
| Alaska Natives | 0.2 /100 | #273 | Tragic 6.0% |
| Cheyenne | 0.2 /100 | #274 | Tragic 6.0% |
| Dutch | 0.2 /100 | #275 | Tragic 6.0% |
| Japanese | 0.1 /100 | #276 | Tragic 6.1% |
| Puget Sound Salish | 0.1 /100 | #277 | Tragic 6.1% |
Demographics Similar to Immigrants from Portugal by Disability Age 5 to 17
In terms of disability age 5 to 17, the demographic groups most similar to Immigrants from Portugal are French (6.4%, a difference of 0.18%), Immigrants from Dominican Republic (6.4%, a difference of 0.18%), Kiowa (6.4%, a difference of 0.31%), Comanche (6.4%, a difference of 0.34%), and Apache (6.4%, a difference of 0.69%).
| Demographics | Rating | Rank | Disability Age 5 to 17 |
| Scotch-Irish | 0.0 /100 | #308 | Tragic 6.3% |
| Hmong | 0.0 /100 | #309 | Tragic 6.3% |
| Alaskan Athabascans | 0.0 /100 | #310 | Tragic 6.3% |
| Immigrants | Dominica | 0.0 /100 | #311 | Tragic 6.3% |
| Bermudans | 0.0 /100 | #312 | Tragic 6.4% |
| Apache | 0.0 /100 | #313 | Tragic 6.4% |
| French | 0.0 /100 | #314 | Tragic 6.4% |
| Immigrants | Portugal | 0.0 /100 | #315 | Tragic 6.4% |
| Immigrants | Dominican Republic | 0.0 /100 | #316 | Tragic 6.4% |
| Kiowa | 0.0 /100 | #317 | Tragic 6.4% |
| Comanche | 0.0 /100 | #318 | Tragic 6.4% |
| Delaware | 0.0 /100 | #319 | Tragic 6.5% |
| Africans | 0.0 /100 | #320 | Tragic 6.5% |
| Tohono O'odham | 0.0 /100 | #321 | Tragic 6.5% |
| Slovaks | 0.0 /100 | #322 | Tragic 6.5% |