Immigrants from India vs Immigrants from Portugal Disability Age 5 to 17
COMPARE
Immigrants from India
Immigrants from Portugal
Disability Age 5 to 17
Disability Age 5 to 17 Comparison
Immigrants from India
Immigrants from Portugal
4.6%
DISABILITY AGE 5 TO 17
100.0/ 100
METRIC RATING
10th/ 347
METRIC RANK
6.4%
DISABILITY AGE 5 TO 17
0.0/ 100
METRIC RATING
315th/ 347
METRIC RANK
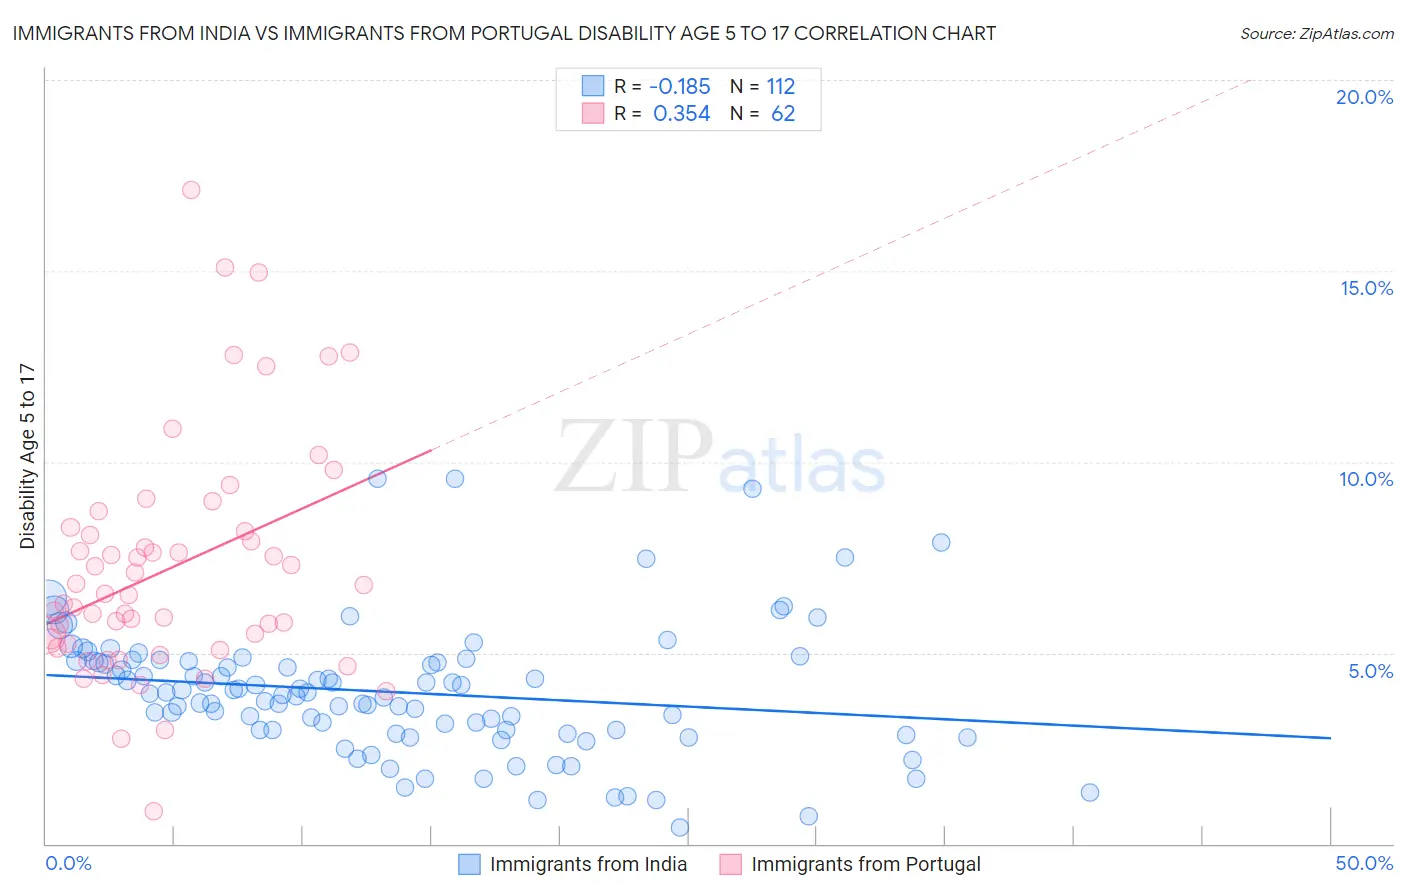
Immigrants from India vs Immigrants from Portugal Disability Age 5 to 17 Correlation Chart
The statistical analysis conducted on geographies consisting of 430,066,965 people shows a poor negative correlation between the proportion of Immigrants from India and percentage of population with a disability between the ages 5 and 17 in the United States with a correlation coefficient (R) of -0.185 and weighted average of 4.6%. Similarly, the statistical analysis conducted on geographies consisting of 173,811,905 people shows a mild positive correlation between the proportion of Immigrants from Portugal and percentage of population with a disability between the ages 5 and 17 in the United States with a correlation coefficient (R) of 0.354 and weighted average of 6.4%, a difference of 40.1%.
Disability Age 5 to 17 Correlation Summary
| Measurement | Immigrants from India | Immigrants from Portugal |
| Minimum | 0.42% | 0.84% |
| Maximum | 9.6% | 17.1% |
| Range | 9.1% | 16.3% |
| Mean | 4.0% | 7.2% |
| Median | 3.9% | 6.5% |
| Interquartile 25% (IQ1) | 3.0% | 5.3% |
| Interquartile 75% (IQ3) | 4.8% | 8.2% |
| Interquartile Range (IQR) | 1.8% | 2.9% |
| Standard Deviation (Sample) | 1.7% | 3.1% |
| Standard Deviation (Population) | 1.7% | 3.1% |
Similar Demographics by Disability Age 5 to 17
Demographics Similar to Immigrants from India by Disability Age 5 to 17
In terms of disability age 5 to 17, the demographic groups most similar to Immigrants from India are Immigrants from Eastern Asia (4.6%, a difference of 0.070%), Armenian (4.6%, a difference of 0.16%), Indian (Asian) (4.6%, a difference of 0.40%), Iranian (4.6%, a difference of 0.40%), and Immigrants from China (4.5%, a difference of 1.3%).
| Demographics | Rating | Rank | Disability Age 5 to 17 |
| Immigrants | Hong Kong | 100.0 /100 | #3 | Exceptional 4.3% |
| Filipinos | 100.0 /100 | #4 | Exceptional 4.3% |
| Immigrants | Iran | 100.0 /100 | #5 | Exceptional 4.4% |
| Immigrants | Israel | 100.0 /100 | #6 | Exceptional 4.5% |
| Immigrants | China | 100.0 /100 | #7 | Exceptional 4.5% |
| Indians (Asian) | 100.0 /100 | #8 | Exceptional 4.6% |
| Immigrants | Eastern Asia | 100.0 /100 | #9 | Exceptional 4.6% |
| Immigrants | India | 100.0 /100 | #10 | Exceptional 4.6% |
| Armenians | 100.0 /100 | #11 | Exceptional 4.6% |
| Iranians | 100.0 /100 | #12 | Exceptional 4.6% |
| Thais | 100.0 /100 | #13 | Exceptional 4.7% |
| Immigrants | Korea | 100.0 /100 | #14 | Exceptional 4.7% |
| Chinese | 100.0 /100 | #15 | Exceptional 4.7% |
| Immigrants | Singapore | 100.0 /100 | #16 | Exceptional 4.7% |
| Arapaho | 100.0 /100 | #17 | Exceptional 4.7% |
Demographics Similar to Immigrants from Portugal by Disability Age 5 to 17
In terms of disability age 5 to 17, the demographic groups most similar to Immigrants from Portugal are French (6.4%, a difference of 0.18%), Immigrants from Dominican Republic (6.4%, a difference of 0.18%), Kiowa (6.4%, a difference of 0.31%), Comanche (6.4%, a difference of 0.34%), and Apache (6.4%, a difference of 0.69%).
| Demographics | Rating | Rank | Disability Age 5 to 17 |
| Scotch-Irish | 0.0 /100 | #308 | Tragic 6.3% |
| Hmong | 0.0 /100 | #309 | Tragic 6.3% |
| Alaskan Athabascans | 0.0 /100 | #310 | Tragic 6.3% |
| Immigrants | Dominica | 0.0 /100 | #311 | Tragic 6.3% |
| Bermudans | 0.0 /100 | #312 | Tragic 6.4% |
| Apache | 0.0 /100 | #313 | Tragic 6.4% |
| French | 0.0 /100 | #314 | Tragic 6.4% |
| Immigrants | Portugal | 0.0 /100 | #315 | Tragic 6.4% |
| Immigrants | Dominican Republic | 0.0 /100 | #316 | Tragic 6.4% |
| Kiowa | 0.0 /100 | #317 | Tragic 6.4% |
| Comanche | 0.0 /100 | #318 | Tragic 6.4% |
| Delaware | 0.0 /100 | #319 | Tragic 6.5% |
| Africans | 0.0 /100 | #320 | Tragic 6.5% |
| Tohono O'odham | 0.0 /100 | #321 | Tragic 6.5% |
| Slovaks | 0.0 /100 | #322 | Tragic 6.5% |