Immigrants from Somalia vs West Indian Disability Age 5 to 17
COMPARE
Immigrants from Somalia
West Indian
Disability Age 5 to 17
Disability Age 5 to 17 Comparison
Immigrants from Somalia
West Indians
6.0%
DISABILITY AGE 5 TO 17
0.4/ 100
METRIC RATING
270th/ 347
METRIC RANK
5.9%
DISABILITY AGE 5 TO 17
2.4/ 100
METRIC RATING
240th/ 347
METRIC RANK
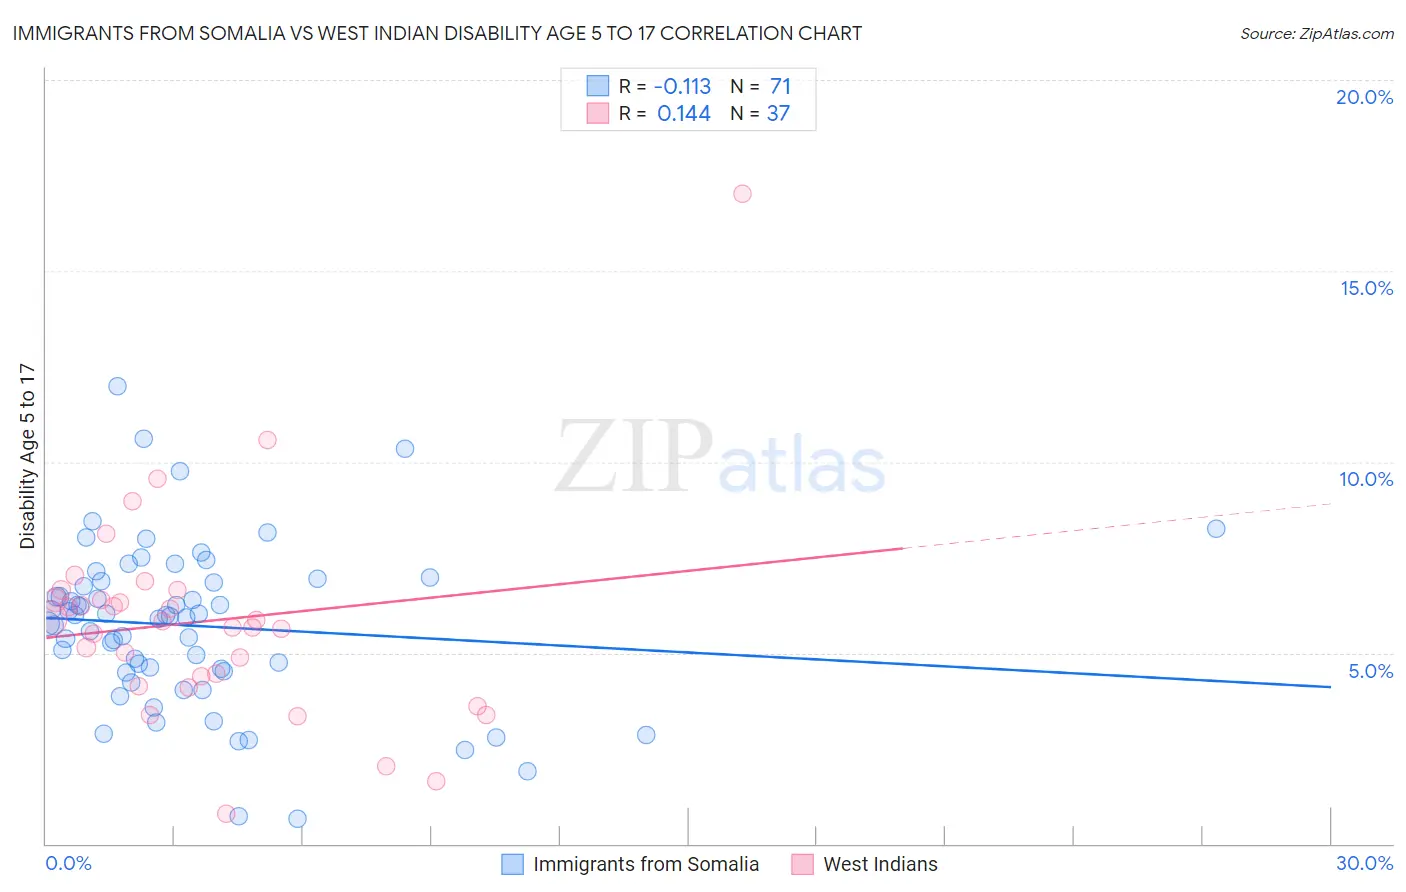
Immigrants from Somalia vs West Indian Disability Age 5 to 17 Correlation Chart
The statistical analysis conducted on geographies consisting of 92,029,922 people shows a poor negative correlation between the proportion of Immigrants from Somalia and percentage of population with a disability between the ages 5 and 17 in the United States with a correlation coefficient (R) of -0.113 and weighted average of 6.0%. Similarly, the statistical analysis conducted on geographies consisting of 253,061,388 people shows a poor positive correlation between the proportion of West Indians and percentage of population with a disability between the ages 5 and 17 in the United States with a correlation coefficient (R) of 0.144 and weighted average of 5.9%, a difference of 2.3%.
Disability Age 5 to 17 Correlation Summary
| Measurement | Immigrants from Somalia | West Indian |
| Minimum | 0.64% | 0.79% |
| Maximum | 12.0% | 17.0% |
| Range | 11.3% | 16.2% |
| Mean | 5.7% | 5.8% |
| Median | 6.0% | 5.8% |
| Interquartile 25% (IQ1) | 4.5% | 4.3% |
| Interquartile 75% (IQ3) | 6.9% | 6.5% |
| Interquartile Range (IQR) | 2.4% | 2.3% |
| Standard Deviation (Sample) | 2.1% | 2.8% |
| Standard Deviation (Population) | 2.1% | 2.7% |
Similar Demographics by Disability Age 5 to 17
Demographics Similar to Immigrants from Somalia by Disability Age 5 to 17
In terms of disability age 5 to 17, the demographic groups most similar to Immigrants from Somalia are Liberian (6.0%, a difference of 0.19%), Sioux (6.0%, a difference of 0.22%), Spanish (6.0%, a difference of 0.41%), Slovene (6.0%, a difference of 0.52%), and Panamanian (6.0%, a difference of 0.55%).
| Demographics | Rating | Rank | Disability Age 5 to 17 |
| Czechoslovakians | 0.7 /100 | #263 | Tragic 5.9% |
| Canadians | 0.6 /100 | #264 | Tragic 6.0% |
| Panamanians | 0.6 /100 | #265 | Tragic 6.0% |
| Slovenes | 0.6 /100 | #266 | Tragic 6.0% |
| Spanish | 0.5 /100 | #267 | Tragic 6.0% |
| Sioux | 0.4 /100 | #268 | Tragic 6.0% |
| Liberians | 0.4 /100 | #269 | Tragic 6.0% |
| Immigrants | Somalia | 0.4 /100 | #270 | Tragic 6.0% |
| Immigrants | Zaire | 0.2 /100 | #271 | Tragic 6.0% |
| Finns | 0.2 /100 | #272 | Tragic 6.0% |
| Alaska Natives | 0.2 /100 | #273 | Tragic 6.0% |
| Cheyenne | 0.2 /100 | #274 | Tragic 6.0% |
| Dutch | 0.2 /100 | #275 | Tragic 6.0% |
| Japanese | 0.1 /100 | #276 | Tragic 6.1% |
| Puget Sound Salish | 0.1 /100 | #277 | Tragic 6.1% |
Demographics Similar to West Indians by Disability Age 5 to 17
In terms of disability age 5 to 17, the demographic groups most similar to West Indians are German Russian (5.9%, a difference of 0.020%), Hungarian (5.8%, a difference of 0.12%), Immigrants from Caribbean (5.9%, a difference of 0.13%), Spaniard (5.9%, a difference of 0.21%), and Sudanese (5.8%, a difference of 0.22%).
| Demographics | Rating | Rank | Disability Age 5 to 17 |
| Immigrants | West Indies | 3.5 /100 | #233 | Tragic 5.8% |
| Immigrants | Kenya | 3.4 /100 | #234 | Tragic 5.8% |
| Malaysians | 3.4 /100 | #235 | Tragic 5.8% |
| Immigrants | Brazil | 3.2 /100 | #236 | Tragic 5.8% |
| Sudanese | 2.9 /100 | #237 | Tragic 5.8% |
| Hungarians | 2.6 /100 | #238 | Tragic 5.8% |
| German Russians | 2.4 /100 | #239 | Tragic 5.9% |
| West Indians | 2.4 /100 | #240 | Tragic 5.9% |
| Immigrants | Caribbean | 2.1 /100 | #241 | Tragic 5.9% |
| Spaniards | 2.0 /100 | #242 | Tragic 5.9% |
| Indonesians | 2.0 /100 | #243 | Tragic 5.9% |
| Immigrants | Germany | 1.9 /100 | #244 | Tragic 5.9% |
| Immigrants | Micronesia | 1.9 /100 | #245 | Tragic 5.9% |
| Tlingit-Haida | 1.9 /100 | #246 | Tragic 5.9% |
| Immigrants | Honduras | 1.8 /100 | #247 | Tragic 5.9% |