Immigrants from Serbia vs Egyptian Vision Disability
COMPARE
Immigrants from Serbia
Egyptian
Vision Disability
Vision Disability Comparison
Immigrants from Serbia
Egyptians
2.0%
VISION DISABILITY
99.4/ 100
METRIC RATING
52nd/ 347
METRIC RANK
1.9%
VISION DISABILITY
99.9/ 100
METRIC RATING
29th/ 347
METRIC RANK
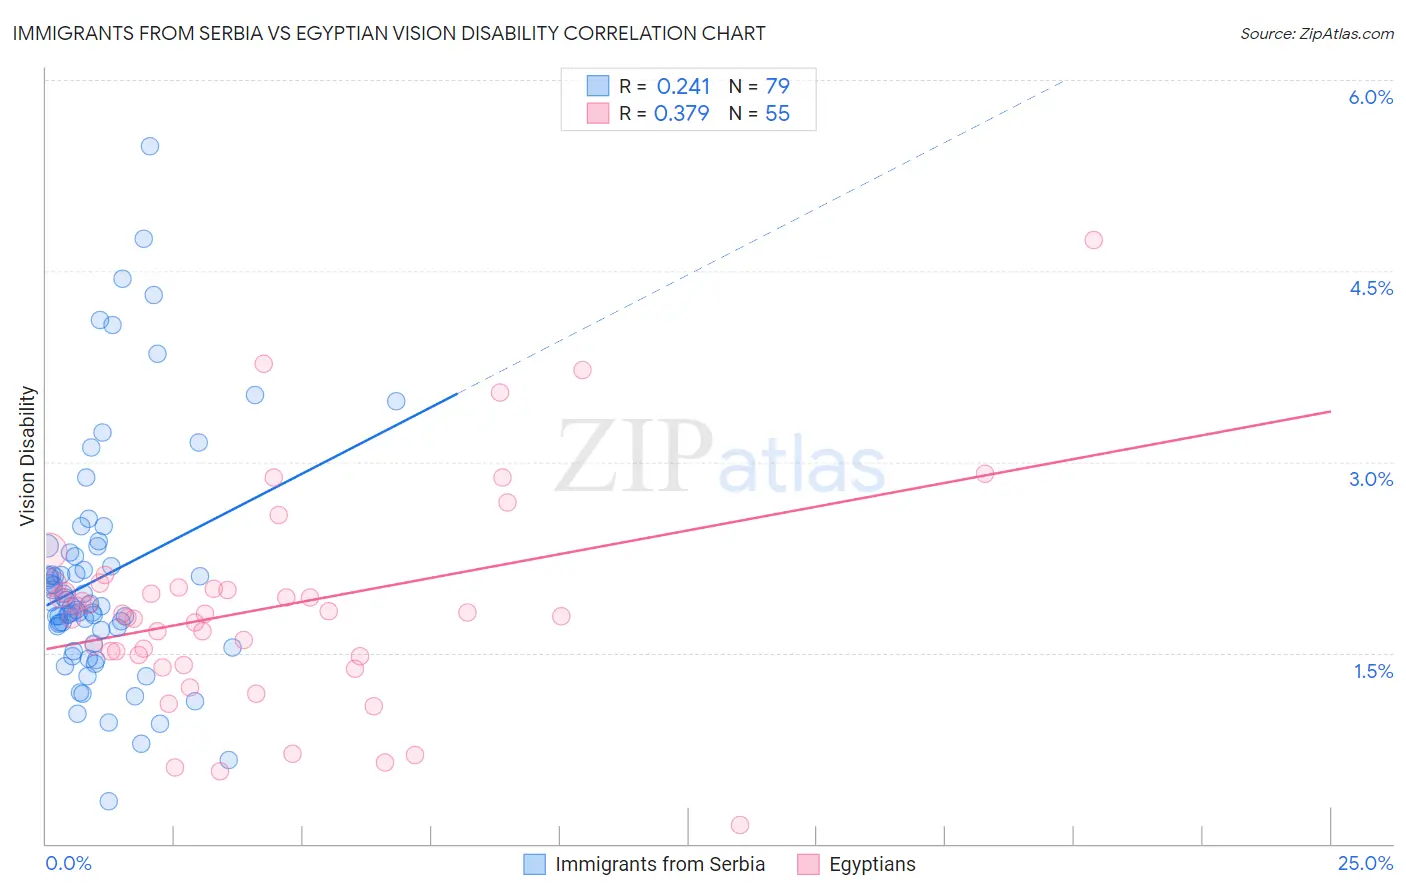
Immigrants from Serbia vs Egyptian Vision Disability Correlation Chart
The statistical analysis conducted on geographies consisting of 131,728,789 people shows a weak positive correlation between the proportion of Immigrants from Serbia and percentage of population with vision disability in the United States with a correlation coefficient (R) of 0.241 and weighted average of 2.0%. Similarly, the statistical analysis conducted on geographies consisting of 276,791,971 people shows a mild positive correlation between the proportion of Egyptians and percentage of population with vision disability in the United States with a correlation coefficient (R) of 0.379 and weighted average of 1.9%, a difference of 3.3%.
Vision Disability Correlation Summary
| Measurement | Immigrants from Serbia | Egyptian |
| Minimum | 0.34% | 0.14% |
| Maximum | 5.5% | 4.7% |
| Range | 5.1% | 4.6% |
| Mean | 2.1% | 1.9% |
| Median | 1.9% | 1.8% |
| Interquartile 25% (IQ1) | 1.6% | 1.5% |
| Interquartile 75% (IQ3) | 2.3% | 2.0% |
| Interquartile Range (IQR) | 0.72% | 0.54% |
| Standard Deviation (Sample) | 0.94% | 0.83% |
| Standard Deviation (Population) | 0.94% | 0.82% |
Similar Demographics by Vision Disability
Demographics Similar to Immigrants from Serbia by Vision Disability
In terms of vision disability, the demographic groups most similar to Immigrants from Serbia are Immigrants from Belarus (2.0%, a difference of 0.11%), Macedonian (2.0%, a difference of 0.15%), Laotian (2.0%, a difference of 0.21%), Tongan (2.0%, a difference of 0.31%), and Jordanian (2.0%, a difference of 0.37%).
| Demographics | Rating | Rank | Vision Disability |
| Ethiopians | 99.7 /100 | #45 | Exceptional 2.0% |
| Immigrants | Sweden | 99.7 /100 | #46 | Exceptional 2.0% |
| Immigrants | Bulgaria | 99.7 /100 | #47 | Exceptional 2.0% |
| Israelis | 99.6 /100 | #48 | Exceptional 2.0% |
| Latvians | 99.5 /100 | #49 | Exceptional 2.0% |
| Afghans | 99.5 /100 | #50 | Exceptional 2.0% |
| Tongans | 99.5 /100 | #51 | Exceptional 2.0% |
| Immigrants | Serbia | 99.4 /100 | #52 | Exceptional 2.0% |
| Immigrants | Belarus | 99.3 /100 | #53 | Exceptional 2.0% |
| Macedonians | 99.3 /100 | #54 | Exceptional 2.0% |
| Laotians | 99.3 /100 | #55 | Exceptional 2.0% |
| Jordanians | 99.2 /100 | #56 | Exceptional 2.0% |
| Somalis | 99.2 /100 | #57 | Exceptional 2.0% |
| Immigrants | Saudi Arabia | 99.2 /100 | #58 | Exceptional 2.0% |
| Argentineans | 99.1 /100 | #59 | Exceptional 2.0% |
Demographics Similar to Egyptians by Vision Disability
In terms of vision disability, the demographic groups most similar to Egyptians are Immigrants from Nepal (1.9%, a difference of 0.040%), Immigrants from Malaysia (1.9%, a difference of 0.070%), Taiwanese (1.9%, a difference of 0.090%), Mongolian (1.9%, a difference of 0.20%), and Immigrants from Japan (1.9%, a difference of 0.43%).
| Demographics | Rating | Rank | Vision Disability |
| Immigrants | Pakistan | 100.0 /100 | #22 | Exceptional 1.9% |
| Immigrants | Asia | 99.9 /100 | #23 | Exceptional 1.9% |
| Immigrants | Lithuania | 99.9 /100 | #24 | Exceptional 1.9% |
| Bulgarians | 99.9 /100 | #25 | Exceptional 1.9% |
| Immigrants | Japan | 99.9 /100 | #26 | Exceptional 1.9% |
| Taiwanese | 99.9 /100 | #27 | Exceptional 1.9% |
| Immigrants | Malaysia | 99.9 /100 | #28 | Exceptional 1.9% |
| Egyptians | 99.9 /100 | #29 | Exceptional 1.9% |
| Immigrants | Nepal | 99.9 /100 | #30 | Exceptional 1.9% |
| Mongolians | 99.9 /100 | #31 | Exceptional 1.9% |
| Luxembourgers | 99.9 /100 | #32 | Exceptional 1.9% |
| Immigrants | Egypt | 99.9 /100 | #33 | Exceptional 1.9% |
| Immigrants | Turkey | 99.8 /100 | #34 | Exceptional 1.9% |
| Immigrants | Australia | 99.8 /100 | #35 | Exceptional 1.9% |
| Cambodians | 99.8 /100 | #36 | Exceptional 2.0% |