Immigrants from Senegal vs Immigrants from Taiwan Unemployment Among Ages 65 to 74 years
COMPARE
Immigrants from Senegal
Immigrants from Taiwan
Unemployment Among Ages 65 to 74 years
Unemployment Among Ages 65 to 74 years Comparison
Immigrants from Senegal
Immigrants from Taiwan
5.4%
UNEMPLOYMENT AMONG AGES 65 TO 74 YEARS
35.2/ 100
METRIC RATING
184th/ 347
METRIC RANK
5.1%
UNEMPLOYMENT AMONG AGES 65 TO 74 YEARS
99.4/ 100
METRIC RATING
61st/ 347
METRIC RANK
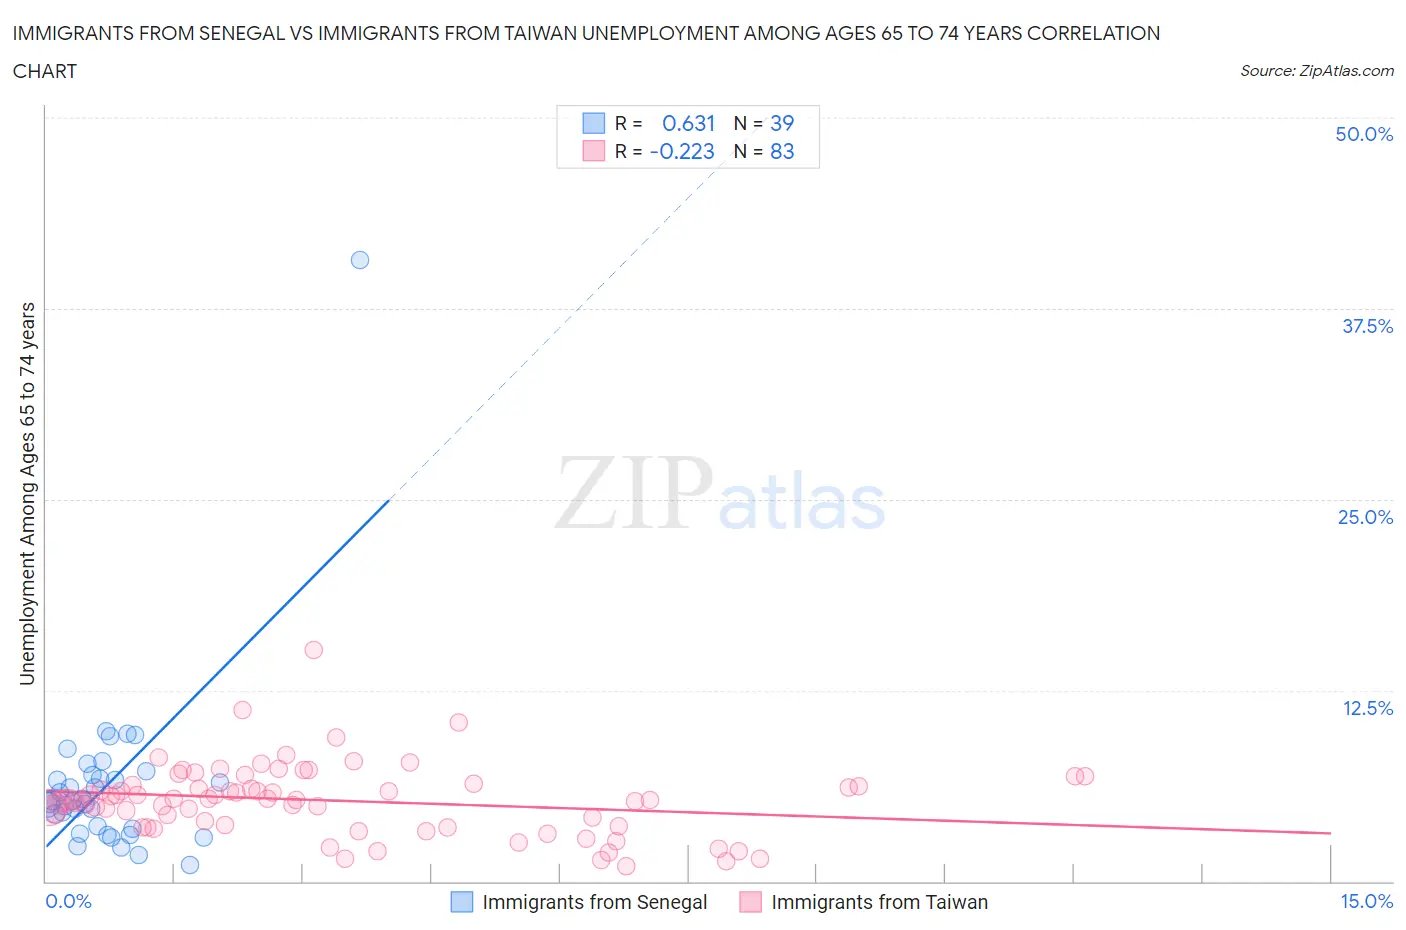
Immigrants from Senegal vs Immigrants from Taiwan Unemployment Among Ages 65 to 74 years Correlation Chart
The statistical analysis conducted on geographies consisting of 87,369,821 people shows a significant positive correlation between the proportion of Immigrants from Senegal and unemployment rate among population between the ages 65 and 74 in the United States with a correlation coefficient (R) of 0.631 and weighted average of 5.4%. Similarly, the statistical analysis conducted on geographies consisting of 273,940,566 people shows a weak negative correlation between the proportion of Immigrants from Taiwan and unemployment rate among population between the ages 65 and 74 in the United States with a correlation coefficient (R) of -0.223 and weighted average of 5.1%, a difference of 4.9%.
Unemployment Among Ages 65 to 74 years Correlation Summary
| Measurement | Immigrants from Senegal | Immigrants from Taiwan |
| Minimum | 1.1% | 1.0% |
| Maximum | 40.7% | 15.1% |
| Range | 39.6% | 14.1% |
| Mean | 6.3% | 5.3% |
| Median | 5.2% | 5.3% |
| Interquartile 25% (IQ1) | 3.4% | 3.6% |
| Interquartile 75% (IQ3) | 7.0% | 6.3% |
| Interquartile Range (IQR) | 3.6% | 2.7% |
| Standard Deviation (Sample) | 6.1% | 2.3% |
| Standard Deviation (Population) | 6.0% | 2.3% |
Similar Demographics by Unemployment Among Ages 65 to 74 years
Demographics Similar to Immigrants from Senegal by Unemployment Among Ages 65 to 74 years
In terms of unemployment among ages 65 to 74 years, the demographic groups most similar to Immigrants from Senegal are Russian (5.4%, a difference of 0.030%), Immigrants from Spain (5.4%, a difference of 0.080%), Lithuanian (5.4%, a difference of 0.10%), Spanish American (5.4%, a difference of 0.11%), and Soviet Union (5.4%, a difference of 0.17%).
| Demographics | Rating | Rank | Unemployment Among Ages 65 to 74 years |
| Arabs | 46.8 /100 | #177 | Average 5.4% |
| French | 43.1 /100 | #178 | Average 5.4% |
| Guamanians/Chamorros | 42.1 /100 | #179 | Average 5.4% |
| Immigrants | Ireland | 42.0 /100 | #180 | Average 5.4% |
| Soviet Union | 40.0 /100 | #181 | Fair 5.4% |
| Spanish Americans | 38.2 /100 | #182 | Fair 5.4% |
| Immigrants | Spain | 37.3 /100 | #183 | Fair 5.4% |
| Immigrants | Senegal | 35.2 /100 | #184 | Fair 5.4% |
| Russians | 34.4 /100 | #185 | Fair 5.4% |
| Lithuanians | 32.4 /100 | #186 | Fair 5.4% |
| Immigrants | Nonimmigrants | 30.6 /100 | #187 | Fair 5.4% |
| Immigrants | Europe | 28.8 /100 | #188 | Fair 5.4% |
| Immigrants | Africa | 28.3 /100 | #189 | Fair 5.4% |
| Basques | 26.6 /100 | #190 | Fair 5.4% |
| Immigrants | Egypt | 26.5 /100 | #191 | Fair 5.4% |
Demographics Similar to Immigrants from Taiwan by Unemployment Among Ages 65 to 74 years
In terms of unemployment among ages 65 to 74 years, the demographic groups most similar to Immigrants from Taiwan are Nicaraguan (5.1%, a difference of 0.010%), Kiowa (5.1%, a difference of 0.050%), Immigrants from Jordan (5.1%, a difference of 0.070%), Immigrants from Moldova (5.1%, a difference of 0.10%), and Bolivian (5.1%, a difference of 0.11%).
| Demographics | Rating | Rank | Unemployment Among Ages 65 to 74 years |
| Immigrants | Nicaragua | 99.6 /100 | #54 | Exceptional 5.1% |
| Carpatho Rusyns | 99.6 /100 | #55 | Exceptional 5.1% |
| Swedes | 99.5 /100 | #56 | Exceptional 5.1% |
| Croatians | 99.5 /100 | #57 | Exceptional 5.1% |
| Germans | 99.5 /100 | #58 | Exceptional 5.1% |
| Immigrants | Bulgaria | 99.4 /100 | #59 | Exceptional 5.1% |
| Immigrants | Jordan | 99.4 /100 | #60 | Exceptional 5.1% |
| Immigrants | Taiwan | 99.4 /100 | #61 | Exceptional 5.1% |
| Nicaraguans | 99.4 /100 | #62 | Exceptional 5.1% |
| Kiowa | 99.3 /100 | #63 | Exceptional 5.1% |
| Immigrants | Moldova | 99.3 /100 | #64 | Exceptional 5.1% |
| Bolivians | 99.3 /100 | #65 | Exceptional 5.1% |
| Iroquois | 99.3 /100 | #66 | Exceptional 5.1% |
| Swiss | 99.2 /100 | #67 | Exceptional 5.1% |
| Latvians | 99.2 /100 | #68 | Exceptional 5.1% |