Immigrants from Senegal vs Blackfeet Disability
COMPARE
Immigrants from Senegal
Blackfeet
Disability
Disability Comparison
Immigrants from Senegal
Blackfeet
12.0%
DISABILITY
9.4/ 100
METRIC RATING
206th/ 347
METRIC RANK
13.6%
DISABILITY
0.0/ 100
METRIC RATING
310th/ 347
METRIC RANK
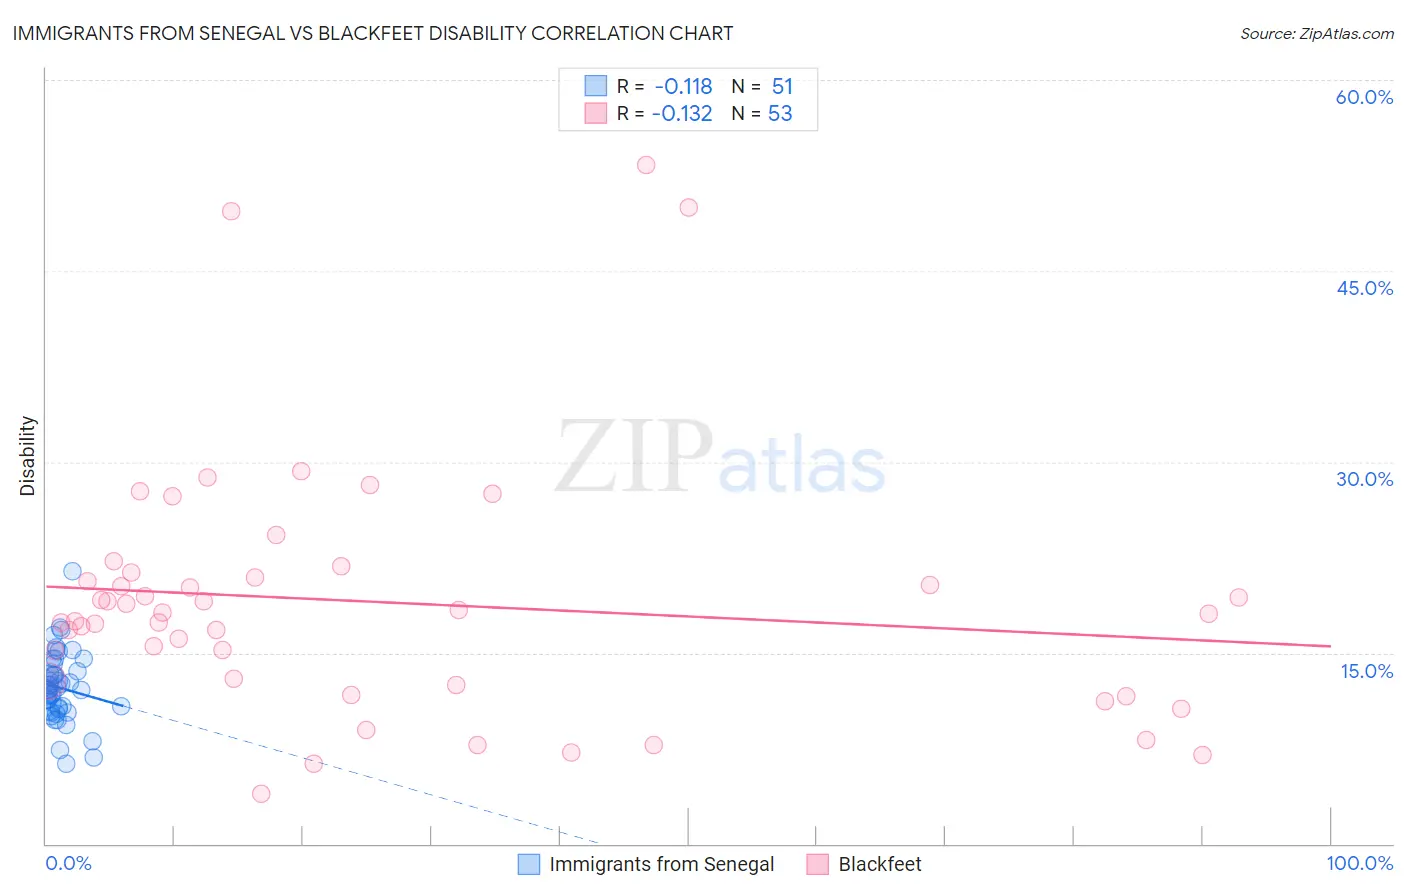
Immigrants from Senegal vs Blackfeet Disability Correlation Chart
The statistical analysis conducted on geographies consisting of 90,129,421 people shows a poor negative correlation between the proportion of Immigrants from Senegal and percentage of population with a disability in the United States with a correlation coefficient (R) of -0.118 and weighted average of 12.0%. Similarly, the statistical analysis conducted on geographies consisting of 309,516,327 people shows a poor negative correlation between the proportion of Blackfeet and percentage of population with a disability in the United States with a correlation coefficient (R) of -0.132 and weighted average of 13.6%, a difference of 13.5%.
Disability Correlation Summary
| Measurement | Immigrants from Senegal | Blackfeet |
| Minimum | 6.3% | 4.0% |
| Maximum | 21.4% | 53.3% |
| Range | 15.1% | 49.4% |
| Mean | 12.3% | 19.0% |
| Median | 12.1% | 18.1% |
| Interquartile 25% (IQ1) | 10.6% | 12.6% |
| Interquartile 75% (IQ3) | 13.6% | 21.1% |
| Interquartile Range (IQR) | 3.0% | 8.5% |
| Standard Deviation (Sample) | 2.7% | 10.0% |
| Standard Deviation (Population) | 2.7% | 9.9% |
Similar Demographics by Disability
Demographics Similar to Immigrants from Senegal by Disability
In terms of disability, the demographic groups most similar to Immigrants from Senegal are Immigrants from Thailand (12.0%, a difference of 0.010%), Immigrants from Caribbean (12.0%, a difference of 0.040%), Immigrants from Western Europe (12.0%, a difference of 0.080%), Danish (12.0%, a difference of 0.080%), and Czech (12.0%, a difference of 0.21%).
| Demographics | Rating | Rank | Disability |
| Immigrants | Panama | 14.6 /100 | #199 | Poor 11.9% |
| Belizeans | 12.8 /100 | #200 | Poor 11.9% |
| Assyrians/Chaldeans/Syriacs | 12.6 /100 | #201 | Poor 11.9% |
| Immigrants | England | 12.0 /100 | #202 | Poor 12.0% |
| British West Indians | 11.5 /100 | #203 | Poor 12.0% |
| Mexican American Indians | 11.4 /100 | #204 | Poor 12.0% |
| Immigrants | Western Europe | 10.1 /100 | #205 | Poor 12.0% |
| Immigrants | Senegal | 9.4 /100 | #206 | Tragic 12.0% |
| Immigrants | Thailand | 9.3 /100 | #207 | Tragic 12.0% |
| Immigrants | Caribbean | 9.1 /100 | #208 | Tragic 12.0% |
| Danes | 8.7 /100 | #209 | Tragic 12.0% |
| Czechs | 7.9 /100 | #210 | Tragic 12.0% |
| Immigrants | Cambodia | 7.3 /100 | #211 | Tragic 12.0% |
| Austrians | 7.2 /100 | #212 | Tragic 12.0% |
| Immigrants | Iraq | 7.1 /100 | #213 | Tragic 12.0% |
Demographics Similar to Blackfeet by Disability
In terms of disability, the demographic groups most similar to Blackfeet are Delaware (13.6%, a difference of 0.040%), Spanish American (13.6%, a difference of 0.28%), Tlingit-Haida (13.5%, a difference of 0.53%), French American Indian (13.5%, a difference of 0.61%), and Cree (13.7%, a difference of 0.63%).
| Demographics | Rating | Rank | Disability |
| Scotch-Irish | 0.0 /100 | #303 | Tragic 13.3% |
| Yakama | 0.0 /100 | #304 | Tragic 13.4% |
| French Canadians | 0.0 /100 | #305 | Tragic 13.4% |
| Cape Verdeans | 0.0 /100 | #306 | Tragic 13.5% |
| Shoshone | 0.0 /100 | #307 | Tragic 13.5% |
| French American Indians | 0.0 /100 | #308 | Tragic 13.5% |
| Tlingit-Haida | 0.0 /100 | #309 | Tragic 13.5% |
| Blackfeet | 0.0 /100 | #310 | Tragic 13.6% |
| Delaware | 0.0 /100 | #311 | Tragic 13.6% |
| Spanish Americans | 0.0 /100 | #312 | Tragic 13.6% |
| Cree | 0.0 /100 | #313 | Tragic 13.7% |
| Blacks/African Americans | 0.0 /100 | #314 | Tragic 13.7% |
| Puget Sound Salish | 0.0 /100 | #315 | Tragic 13.7% |
| Pima | 0.0 /100 | #316 | Tragic 13.7% |
| Immigrants | Cabo Verde | 0.0 /100 | #317 | Tragic 13.7% |