Immigrants from Senegal vs Lebanese Self-Care Disability
COMPARE
Immigrants from Senegal
Lebanese
Self-Care Disability
Self-Care Disability Comparison
Immigrants from Senegal
Lebanese
2.6%
SELF-CARE DISABILITY
1.6/ 100
METRIC RATING
237th/ 347
METRIC RANK
2.4%
SELF-CARE DISABILITY
66.5/ 100
METRIC RATING
161st/ 347
METRIC RANK
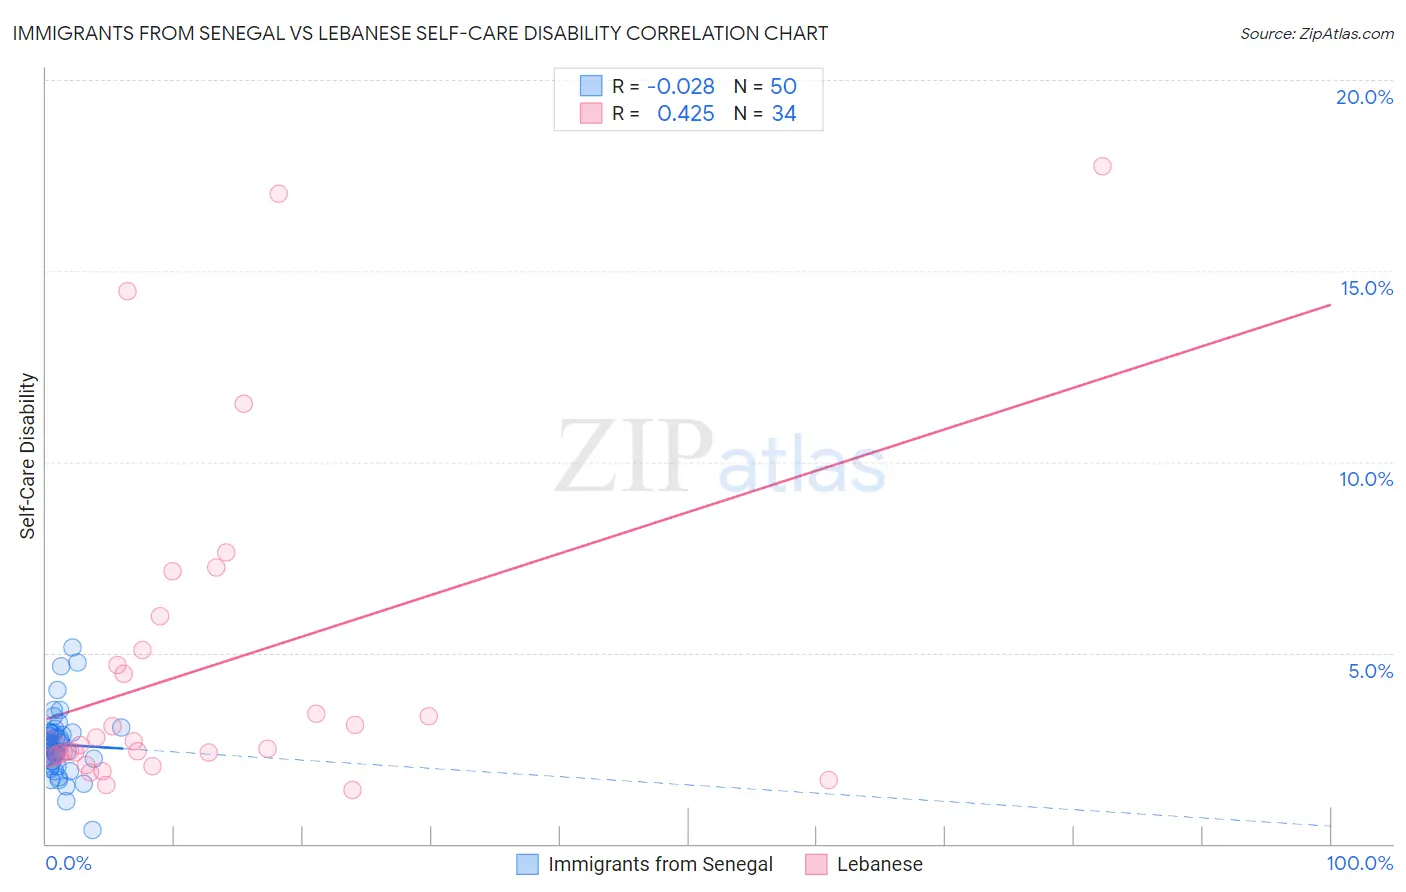
Immigrants from Senegal vs Lebanese Self-Care Disability Correlation Chart
The statistical analysis conducted on geographies consisting of 90,114,981 people shows no correlation between the proportion of Immigrants from Senegal and percentage of population with self-care disability in the United States with a correlation coefficient (R) of -0.028 and weighted average of 2.6%. Similarly, the statistical analysis conducted on geographies consisting of 401,146,528 people shows a moderate positive correlation between the proportion of Lebanese and percentage of population with self-care disability in the United States with a correlation coefficient (R) of 0.425 and weighted average of 2.4%, a difference of 5.8%.
Self-Care Disability Correlation Summary
| Measurement | Immigrants from Senegal | Lebanese |
| Minimum | 0.36% | 1.4% |
| Maximum | 5.1% | 17.8% |
| Range | 4.8% | 16.4% |
| Mean | 2.6% | 4.6% |
| Median | 2.6% | 2.6% |
| Interquartile 25% (IQ1) | 2.2% | 2.3% |
| Interquartile 75% (IQ3) | 2.9% | 5.1% |
| Interquartile Range (IQR) | 0.75% | 2.7% |
| Standard Deviation (Sample) | 0.85% | 4.3% |
| Standard Deviation (Population) | 0.84% | 4.3% |
Similar Demographics by Self-Care Disability
Demographics Similar to Immigrants from Senegal by Self-Care Disability
In terms of self-care disability, the demographic groups most similar to Immigrants from Senegal are Bermudan (2.6%, a difference of 0.20%), Senegalese (2.6%, a difference of 0.26%), Bahamian (2.6%, a difference of 0.27%), Vietnamese (2.6%, a difference of 0.30%), and Liberian (2.6%, a difference of 0.31%).
| Demographics | Rating | Rank | Self-Care Disability |
| Immigrants | Ecuador | 2.5 /100 | #230 | Tragic 2.6% |
| Immigrants | Guatemala | 2.2 /100 | #231 | Tragic 2.6% |
| Albanians | 2.2 /100 | #232 | Tragic 2.6% |
| Liberians | 2.1 /100 | #233 | Tragic 2.6% |
| Vietnamese | 2.1 /100 | #234 | Tragic 2.6% |
| Bahamians | 2.0 /100 | #235 | Tragic 2.6% |
| Bermudans | 1.9 /100 | #236 | Tragic 2.6% |
| Immigrants | Senegal | 1.6 /100 | #237 | Tragic 2.6% |
| Senegalese | 1.3 /100 | #238 | Tragic 2.6% |
| Immigrants | Panama | 1.2 /100 | #239 | Tragic 2.6% |
| Marshallese | 1.2 /100 | #240 | Tragic 2.6% |
| Immigrants | Syria | 1.0 /100 | #241 | Tragic 2.6% |
| Spanish | 0.8 /100 | #242 | Tragic 2.6% |
| Hawaiians | 0.8 /100 | #243 | Tragic 2.6% |
| Yuman | 0.8 /100 | #244 | Tragic 2.6% |
Demographics Similar to Lebanese by Self-Care Disability
In terms of self-care disability, the demographic groups most similar to Lebanese are Finnish (2.4%, a difference of 0.030%), Immigrants from Western Europe (2.4%, a difference of 0.11%), Immigrants from Italy (2.4%, a difference of 0.11%), Somali (2.5%, a difference of 0.14%), and Immigrants from Europe (2.4%, a difference of 0.17%).
| Demographics | Rating | Rank | Self-Care Disability |
| Italians | 72.2 /100 | #154 | Good 2.4% |
| Pakistanis | 71.4 /100 | #155 | Good 2.4% |
| Nigerians | 70.6 /100 | #156 | Good 2.4% |
| Immigrants | Europe | 69.6 /100 | #157 | Good 2.4% |
| Immigrants | Western Europe | 68.6 /100 | #158 | Good 2.4% |
| Immigrants | Italy | 68.5 /100 | #159 | Good 2.4% |
| Finns | 67.0 /100 | #160 | Good 2.4% |
| Lebanese | 66.5 /100 | #161 | Good 2.4% |
| Somalis | 63.7 /100 | #162 | Good 2.5% |
| German Russians | 62.7 /100 | #163 | Good 2.5% |
| Immigrants | Vietnam | 59.3 /100 | #164 | Average 2.5% |
| Syrians | 59.0 /100 | #165 | Average 2.5% |
| Canadians | 58.8 /100 | #166 | Average 2.5% |
| Immigrants | Greece | 57.3 /100 | #167 | Average 2.5% |
| Ute | 57.1 /100 | #168 | Average 2.5% |