Immigrants from Senegal vs Serbian Self-Care Disability
COMPARE
Immigrants from Senegal
Serbian
Self-Care Disability
Self-Care Disability Comparison
Immigrants from Senegal
Serbians
2.6%
SELF-CARE DISABILITY
1.6/ 100
METRIC RATING
237th/ 347
METRIC RANK
2.4%
SELF-CARE DISABILITY
93.6/ 100
METRIC RATING
111th/ 347
METRIC RANK
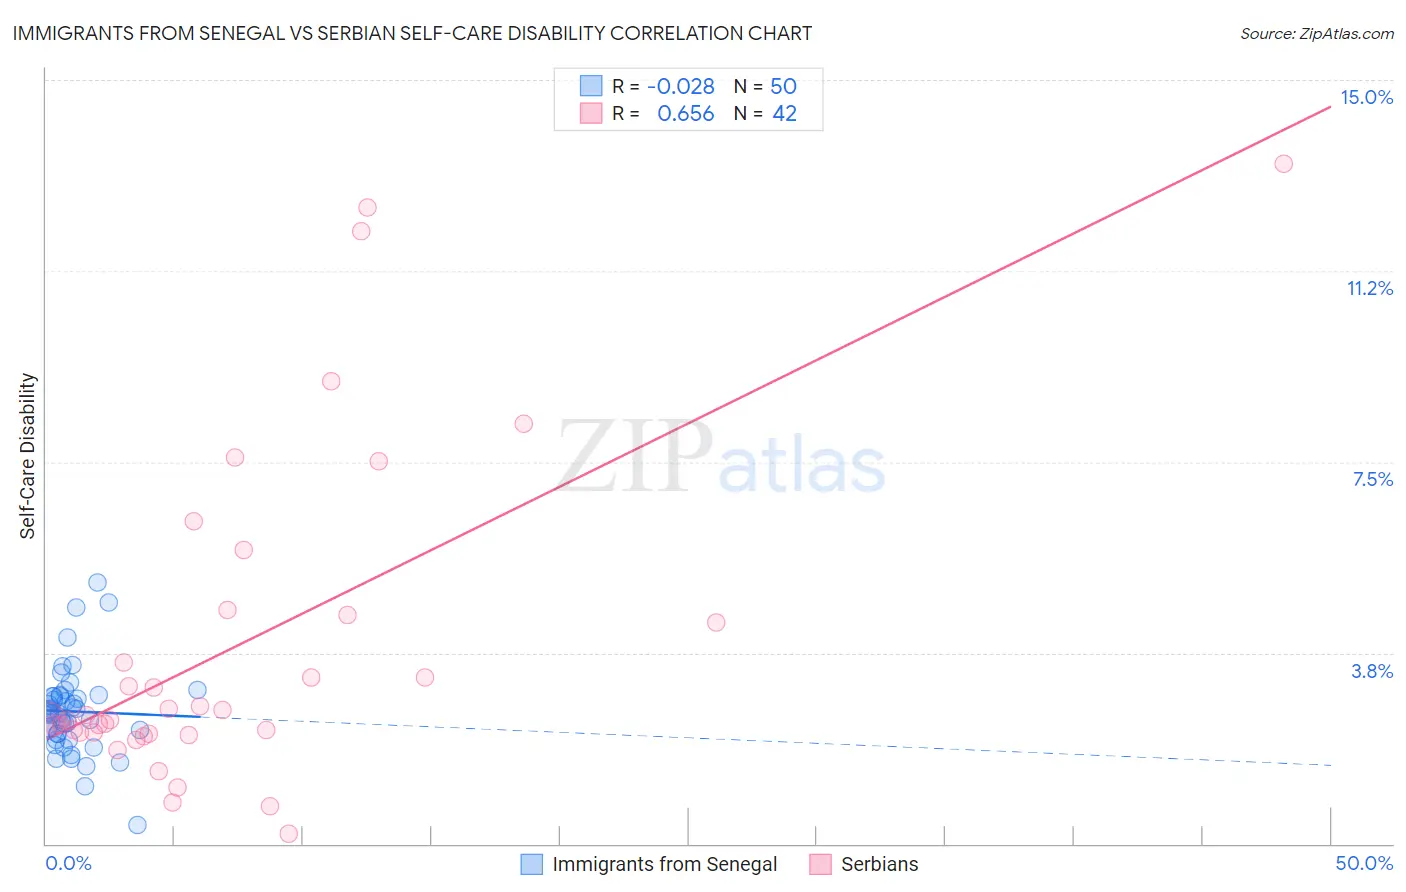
Immigrants from Senegal vs Serbian Self-Care Disability Correlation Chart
The statistical analysis conducted on geographies consisting of 90,114,981 people shows no correlation between the proportion of Immigrants from Senegal and percentage of population with self-care disability in the United States with a correlation coefficient (R) of -0.028 and weighted average of 2.6%. Similarly, the statistical analysis conducted on geographies consisting of 267,466,690 people shows a significant positive correlation between the proportion of Serbians and percentage of population with self-care disability in the United States with a correlation coefficient (R) of 0.656 and weighted average of 2.4%, a difference of 8.4%.
Self-Care Disability Correlation Summary
| Measurement | Immigrants from Senegal | Serbian |
| Minimum | 0.36% | 0.20% |
| Maximum | 5.1% | 13.4% |
| Range | 4.8% | 13.2% |
| Mean | 2.6% | 3.9% |
| Median | 2.6% | 2.5% |
| Interquartile 25% (IQ1) | 2.2% | 2.2% |
| Interquartile 75% (IQ3) | 2.9% | 4.5% |
| Interquartile Range (IQR) | 0.75% | 2.3% |
| Standard Deviation (Sample) | 0.85% | 3.2% |
| Standard Deviation (Population) | 0.84% | 3.1% |
Similar Demographics by Self-Care Disability
Demographics Similar to Immigrants from Senegal by Self-Care Disability
In terms of self-care disability, the demographic groups most similar to Immigrants from Senegal are Bermudan (2.6%, a difference of 0.20%), Senegalese (2.6%, a difference of 0.26%), Bahamian (2.6%, a difference of 0.27%), Vietnamese (2.6%, a difference of 0.30%), and Liberian (2.6%, a difference of 0.31%).
| Demographics | Rating | Rank | Self-Care Disability |
| Immigrants | Ecuador | 2.5 /100 | #230 | Tragic 2.6% |
| Immigrants | Guatemala | 2.2 /100 | #231 | Tragic 2.6% |
| Albanians | 2.2 /100 | #232 | Tragic 2.6% |
| Liberians | 2.1 /100 | #233 | Tragic 2.6% |
| Vietnamese | 2.1 /100 | #234 | Tragic 2.6% |
| Bahamians | 2.0 /100 | #235 | Tragic 2.6% |
| Bermudans | 1.9 /100 | #236 | Tragic 2.6% |
| Immigrants | Senegal | 1.6 /100 | #237 | Tragic 2.6% |
| Senegalese | 1.3 /100 | #238 | Tragic 2.6% |
| Immigrants | Panama | 1.2 /100 | #239 | Tragic 2.6% |
| Marshallese | 1.2 /100 | #240 | Tragic 2.6% |
| Immigrants | Syria | 1.0 /100 | #241 | Tragic 2.6% |
| Spanish | 0.8 /100 | #242 | Tragic 2.6% |
| Hawaiians | 0.8 /100 | #243 | Tragic 2.6% |
| Yuman | 0.8 /100 | #244 | Tragic 2.6% |
Demographics Similar to Serbians by Self-Care Disability
In terms of self-care disability, the demographic groups most similar to Serbians are Immigrants from Africa (2.4%, a difference of 0.020%), Scandinavian (2.4%, a difference of 0.020%), South American (2.4%, a difference of 0.090%), Immigrants from North Macedonia (2.4%, a difference of 0.090%), and Immigrants from Hong Kong (2.4%, a difference of 0.090%).
| Demographics | Rating | Rank | Self-Care Disability |
| Bhutanese | 94.5 /100 | #104 | Exceptional 2.4% |
| Carpatho Rusyns | 94.4 /100 | #105 | Exceptional 2.4% |
| Immigrants | Indonesia | 94.3 /100 | #106 | Exceptional 2.4% |
| British | 94.3 /100 | #107 | Exceptional 2.4% |
| Greeks | 94.1 /100 | #108 | Exceptional 2.4% |
| Slovenes | 94.1 /100 | #109 | Exceptional 2.4% |
| Immigrants | Africa | 93.7 /100 | #110 | Exceptional 2.4% |
| Serbians | 93.6 /100 | #111 | Exceptional 2.4% |
| Scandinavians | 93.5 /100 | #112 | Exceptional 2.4% |
| South Americans | 93.2 /100 | #113 | Exceptional 2.4% |
| Immigrants | North Macedonia | 93.1 /100 | #114 | Exceptional 2.4% |
| Immigrants | Hong Kong | 93.1 /100 | #115 | Exceptional 2.4% |
| Northern Europeans | 92.9 /100 | #116 | Exceptional 2.4% |
| Taiwanese | 92.5 /100 | #117 | Exceptional 2.4% |
| Immigrants | Canada | 92.0 /100 | #118 | Exceptional 2.4% |