Immigrants from Senegal vs Immigrants from Morocco Self-Care Disability
COMPARE
Immigrants from Senegal
Immigrants from Morocco
Self-Care Disability
Self-Care Disability Comparison
Immigrants from Senegal
Immigrants from Morocco
2.6%
SELF-CARE DISABILITY
1.6/ 100
METRIC RATING
237th/ 347
METRIC RANK
2.4%
SELF-CARE DISABILITY
90.2/ 100
METRIC RATING
124th/ 347
METRIC RANK
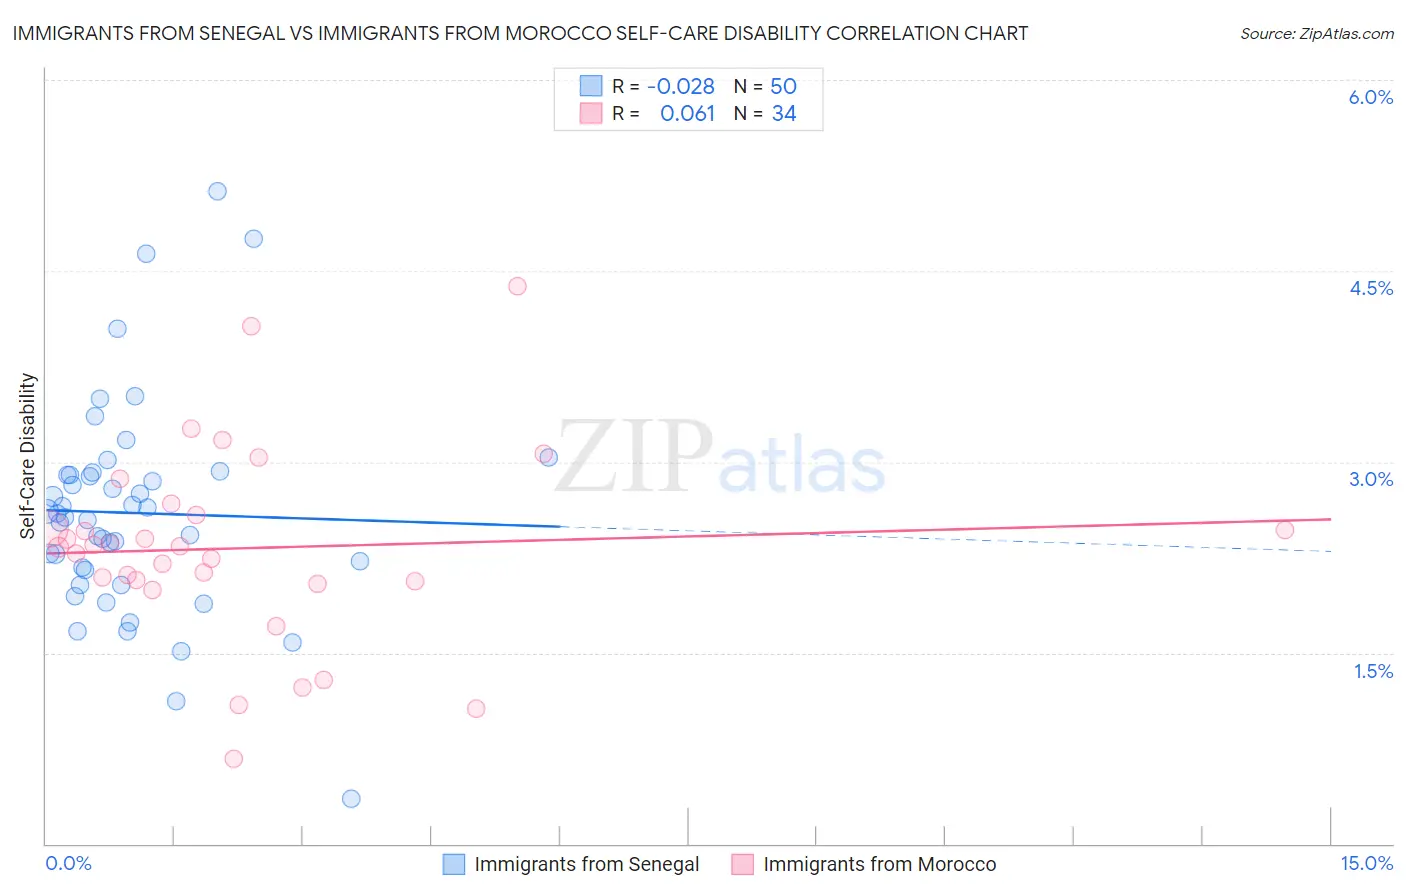
Immigrants from Senegal vs Immigrants from Morocco Self-Care Disability Correlation Chart
The statistical analysis conducted on geographies consisting of 90,114,981 people shows no correlation between the proportion of Immigrants from Senegal and percentage of population with self-care disability in the United States with a correlation coefficient (R) of -0.028 and weighted average of 2.6%. Similarly, the statistical analysis conducted on geographies consisting of 178,885,702 people shows a slight positive correlation between the proportion of Immigrants from Morocco and percentage of population with self-care disability in the United States with a correlation coefficient (R) of 0.061 and weighted average of 2.4%, a difference of 7.7%.
Self-Care Disability Correlation Summary
| Measurement | Immigrants from Senegal | Immigrants from Morocco |
| Minimum | 0.36% | 0.66% |
| Maximum | 5.1% | 4.4% |
| Range | 4.8% | 3.7% |
| Mean | 2.6% | 2.3% |
| Median | 2.6% | 2.3% |
| Interquartile 25% (IQ1) | 2.2% | 2.1% |
| Interquartile 75% (IQ3) | 2.9% | 2.6% |
| Interquartile Range (IQR) | 0.75% | 0.52% |
| Standard Deviation (Sample) | 0.85% | 0.77% |
| Standard Deviation (Population) | 0.84% | 0.76% |
Similar Demographics by Self-Care Disability
Demographics Similar to Immigrants from Senegal by Self-Care Disability
In terms of self-care disability, the demographic groups most similar to Immigrants from Senegal are Bermudan (2.6%, a difference of 0.20%), Senegalese (2.6%, a difference of 0.26%), Bahamian (2.6%, a difference of 0.27%), Vietnamese (2.6%, a difference of 0.30%), and Liberian (2.6%, a difference of 0.31%).
| Demographics | Rating | Rank | Self-Care Disability |
| Immigrants | Ecuador | 2.5 /100 | #230 | Tragic 2.6% |
| Immigrants | Guatemala | 2.2 /100 | #231 | Tragic 2.6% |
| Albanians | 2.2 /100 | #232 | Tragic 2.6% |
| Liberians | 2.1 /100 | #233 | Tragic 2.6% |
| Vietnamese | 2.1 /100 | #234 | Tragic 2.6% |
| Bahamians | 2.0 /100 | #235 | Tragic 2.6% |
| Bermudans | 1.9 /100 | #236 | Tragic 2.6% |
| Immigrants | Senegal | 1.6 /100 | #237 | Tragic 2.6% |
| Senegalese | 1.3 /100 | #238 | Tragic 2.6% |
| Immigrants | Panama | 1.2 /100 | #239 | Tragic 2.6% |
| Marshallese | 1.2 /100 | #240 | Tragic 2.6% |
| Immigrants | Syria | 1.0 /100 | #241 | Tragic 2.6% |
| Spanish | 0.8 /100 | #242 | Tragic 2.6% |
| Hawaiians | 0.8 /100 | #243 | Tragic 2.6% |
| Yuman | 0.8 /100 | #244 | Tragic 2.6% |
Demographics Similar to Immigrants from Morocco by Self-Care Disability
In terms of self-care disability, the demographic groups most similar to Immigrants from Morocco are Immigrants from North America (2.4%, a difference of 0.0%), Immigrants from Nigeria (2.4%, a difference of 0.010%), Hmong (2.4%, a difference of 0.040%), Colombian (2.4%, a difference of 0.070%), and Immigrants from Hungary (2.4%, a difference of 0.080%).
| Demographics | Rating | Rank | Self-Care Disability |
| Taiwanese | 92.5 /100 | #117 | Exceptional 2.4% |
| Immigrants | Canada | 92.0 /100 | #118 | Exceptional 2.4% |
| Immigrants | Sierra Leone | 91.8 /100 | #119 | Exceptional 2.4% |
| Uruguayans | 91.5 /100 | #120 | Exceptional 2.4% |
| Peruvians | 91.3 /100 | #121 | Exceptional 2.4% |
| Belgians | 90.9 /100 | #122 | Exceptional 2.4% |
| Immigrants | Nigeria | 90.3 /100 | #123 | Exceptional 2.4% |
| Immigrants | North America | 90.2 /100 | #124 | Exceptional 2.4% |
| Immigrants | Morocco | 90.2 /100 | #124 | Exceptional 2.4% |
| Hmong | 89.9 /100 | #126 | Excellent 2.4% |
| Colombians | 89.7 /100 | #127 | Excellent 2.4% |
| Immigrants | Hungary | 89.6 /100 | #128 | Excellent 2.4% |
| Immigrants | Romania | 89.3 /100 | #129 | Excellent 2.4% |
| Immigrants | Austria | 89.0 /100 | #130 | Excellent 2.4% |
| Poles | 88.9 /100 | #131 | Excellent 2.4% |