Immigrants from Japan vs Panamanian Disability
COMPARE
Immigrants from Japan
Panamanian
Disability
Disability Comparison
Immigrants from Japan
Panamanians
10.8%
DISABILITY
99.9/ 100
METRIC RATING
44th/ 347
METRIC RANK
12.1%
DISABILITY
5.4/ 100
METRIC RATING
216th/ 347
METRIC RANK
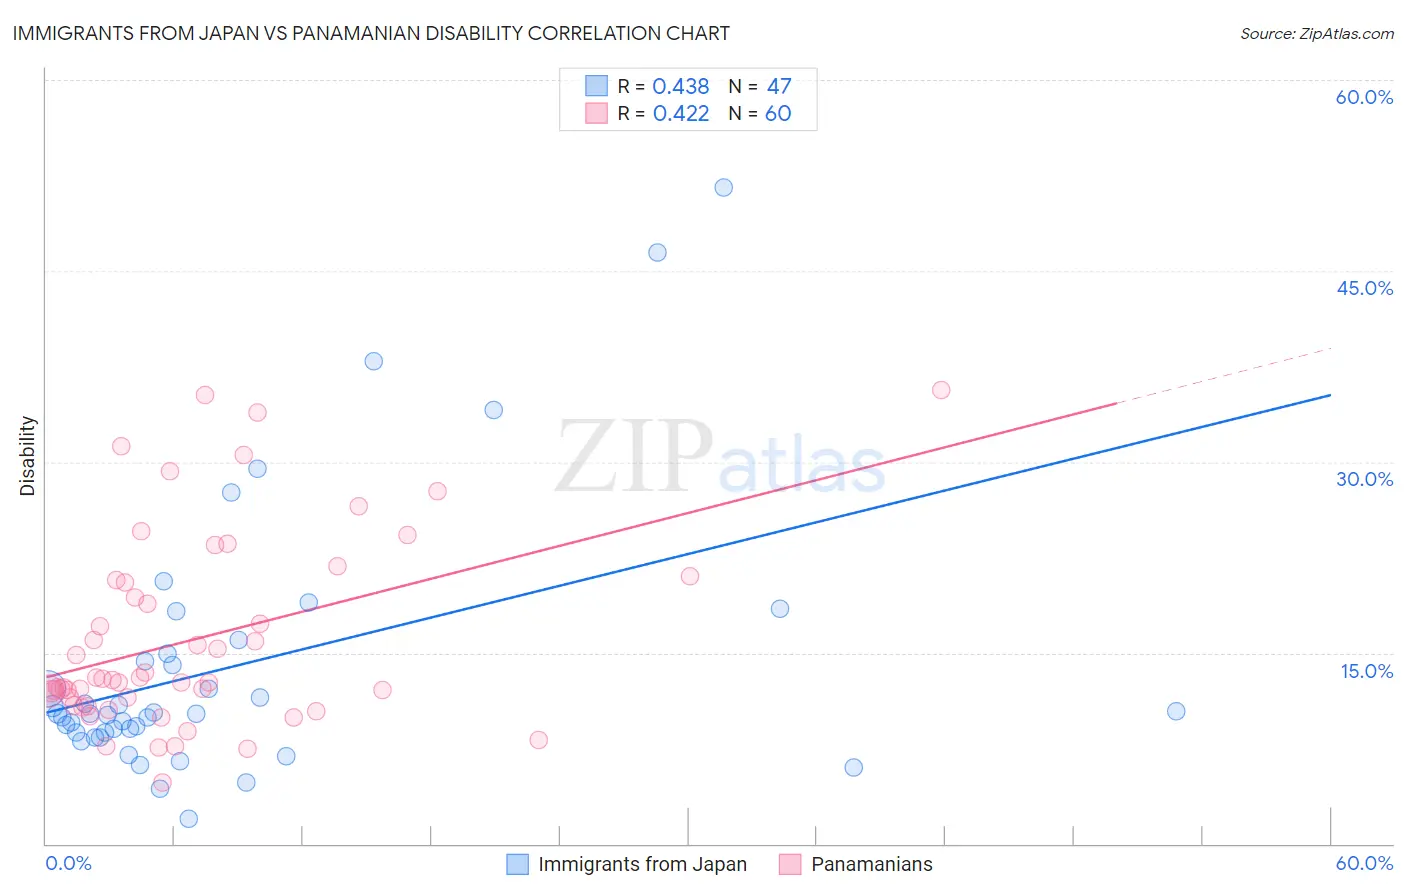
Immigrants from Japan vs Panamanian Disability Correlation Chart
The statistical analysis conducted on geographies consisting of 340,149,948 people shows a moderate positive correlation between the proportion of Immigrants from Japan and percentage of population with a disability in the United States with a correlation coefficient (R) of 0.438 and weighted average of 10.8%. Similarly, the statistical analysis conducted on geographies consisting of 281,200,623 people shows a moderate positive correlation between the proportion of Panamanians and percentage of population with a disability in the United States with a correlation coefficient (R) of 0.422 and weighted average of 12.1%, a difference of 11.8%.
Disability Correlation Summary
| Measurement | Immigrants from Japan | Panamanian |
| Minimum | 2.0% | 4.8% |
| Maximum | 51.5% | 35.6% |
| Range | 49.5% | 30.8% |
| Mean | 13.9% | 16.1% |
| Median | 10.2% | 12.8% |
| Interquartile 25% (IQ1) | 8.7% | 11.2% |
| Interquartile 75% (IQ3) | 14.9% | 20.6% |
| Interquartile Range (IQR) | 6.2% | 9.5% |
| Standard Deviation (Sample) | 10.5% | 7.5% |
| Standard Deviation (Population) | 10.3% | 7.5% |
Similar Demographics by Disability
Demographics Similar to Immigrants from Japan by Disability
In terms of disability, the demographic groups most similar to Immigrants from Japan are Israeli (10.8%, a difference of 0.10%), Immigrants from Nepal (10.8%, a difference of 0.15%), Immigrants from Australia (10.8%, a difference of 0.25%), Cambodian (10.8%, a difference of 0.29%), and Mongolian (10.8%, a difference of 0.29%).
| Demographics | Rating | Rank | Disability |
| Turks | 100.0 /100 | #37 | Exceptional 10.7% |
| Afghans | 99.9 /100 | #38 | Exceptional 10.8% |
| Cambodians | 99.9 /100 | #39 | Exceptional 10.8% |
| Mongolians | 99.9 /100 | #40 | Exceptional 10.8% |
| Immigrants | Australia | 99.9 /100 | #41 | Exceptional 10.8% |
| Immigrants | Nepal | 99.9 /100 | #42 | Exceptional 10.8% |
| Israelis | 99.9 /100 | #43 | Exceptional 10.8% |
| Immigrants | Japan | 99.9 /100 | #44 | Exceptional 10.8% |
| Immigrants | Peru | 99.9 /100 | #45 | Exceptional 10.8% |
| Tongans | 99.9 /100 | #46 | Exceptional 10.8% |
| Taiwanese | 99.9 /100 | #47 | Exceptional 10.8% |
| Soviet Union | 99.9 /100 | #48 | Exceptional 10.9% |
| Vietnamese | 99.9 /100 | #49 | Exceptional 10.9% |
| Immigrants | Saudi Arabia | 99.9 /100 | #50 | Exceptional 10.9% |
| Peruvians | 99.8 /100 | #51 | Exceptional 10.9% |
Demographics Similar to Panamanians by Disability
In terms of disability, the demographic groups most similar to Panamanians are Immigrants from North America (12.1%, a difference of 0.010%), Immigrants from Jamaica (12.1%, a difference of 0.070%), Croatian (12.1%, a difference of 0.11%), Immigrants from Canada (12.1%, a difference of 0.15%), and Immigrants from Bahamas (12.1%, a difference of 0.16%).
| Demographics | Rating | Rank | Disability |
| Danes | 8.7 /100 | #209 | Tragic 12.0% |
| Czechs | 7.9 /100 | #210 | Tragic 12.0% |
| Immigrants | Cambodia | 7.3 /100 | #211 | Tragic 12.0% |
| Austrians | 7.2 /100 | #212 | Tragic 12.0% |
| Immigrants | Iraq | 7.1 /100 | #213 | Tragic 12.0% |
| Immigrants | Somalia | 6.8 /100 | #214 | Tragic 12.0% |
| Immigrants | Canada | 6.1 /100 | #215 | Tragic 12.1% |
| Panamanians | 5.4 /100 | #216 | Tragic 12.1% |
| Immigrants | North America | 5.3 /100 | #217 | Tragic 12.1% |
| Immigrants | Jamaica | 5.0 /100 | #218 | Tragic 12.1% |
| Croatians | 4.9 /100 | #219 | Tragic 12.1% |
| Immigrants | Bahamas | 4.7 /100 | #220 | Tragic 12.1% |
| Northern Europeans | 4.2 /100 | #221 | Tragic 12.1% |
| Spanish American Indians | 4.1 /100 | #222 | Tragic 12.1% |
| Hispanics or Latinos | 3.9 /100 | #223 | Tragic 12.1% |