Immigrants from Ireland vs Panamanian Disability
COMPARE
Immigrants from Ireland
Panamanian
Disability
Disability Comparison
Immigrants from Ireland
Panamanians
11.1%
DISABILITY
99.3/ 100
METRIC RATING
80th/ 347
METRIC RANK
12.1%
DISABILITY
5.4/ 100
METRIC RATING
216th/ 347
METRIC RANK
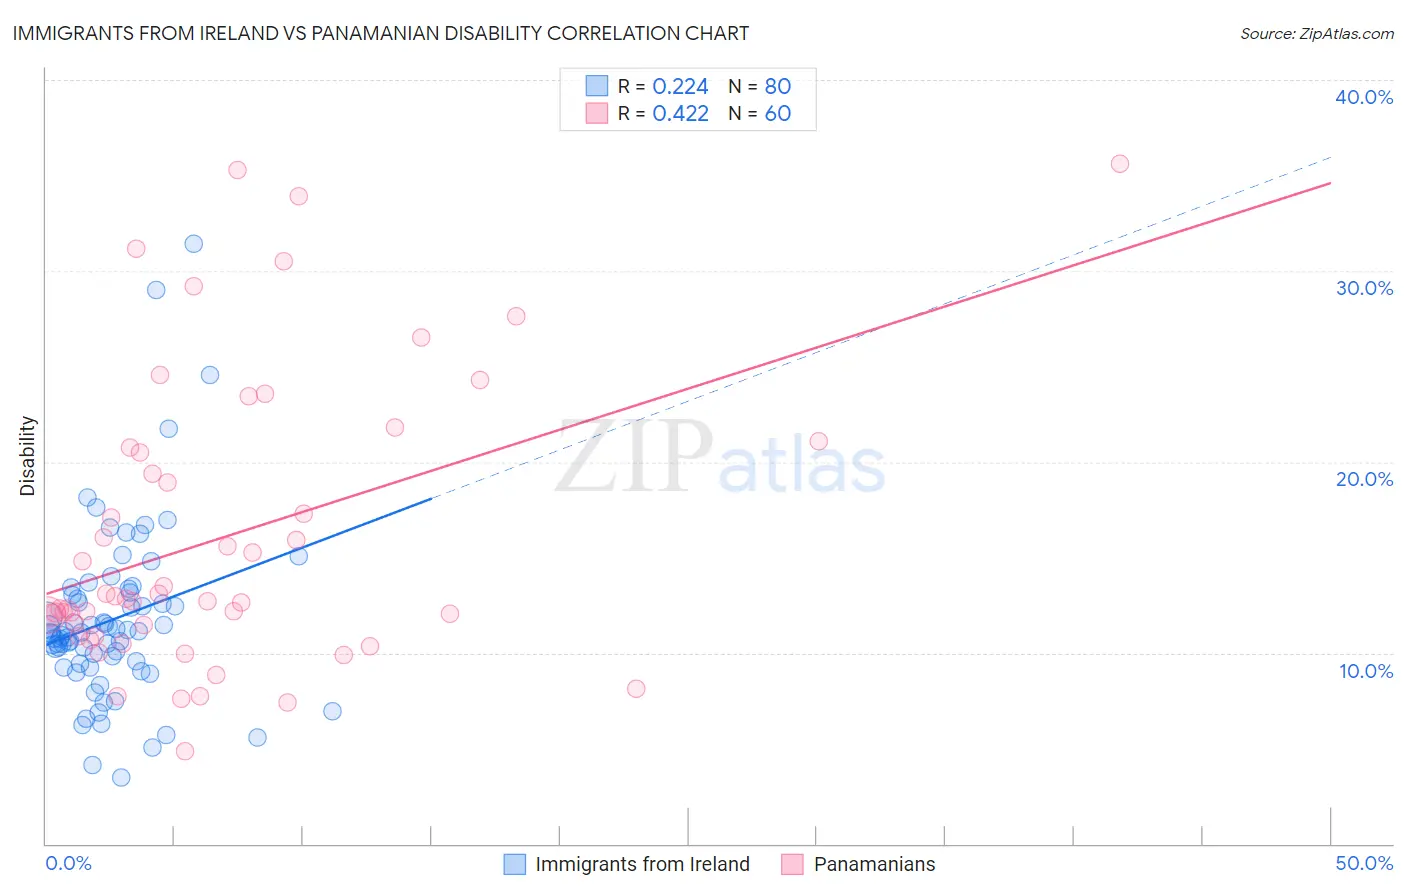
Immigrants from Ireland vs Panamanian Disability Correlation Chart
The statistical analysis conducted on geographies consisting of 240,775,613 people shows a weak positive correlation between the proportion of Immigrants from Ireland and percentage of population with a disability in the United States with a correlation coefficient (R) of 0.224 and weighted average of 11.1%. Similarly, the statistical analysis conducted on geographies consisting of 281,200,623 people shows a moderate positive correlation between the proportion of Panamanians and percentage of population with a disability in the United States with a correlation coefficient (R) of 0.422 and weighted average of 12.1%, a difference of 9.1%.
Disability Correlation Summary
| Measurement | Immigrants from Ireland | Panamanian |
| Minimum | 3.4% | 4.8% |
| Maximum | 31.4% | 35.6% |
| Range | 28.0% | 30.8% |
| Mean | 11.7% | 16.1% |
| Median | 11.0% | 12.8% |
| Interquartile 25% (IQ1) | 9.5% | 11.2% |
| Interquartile 75% (IQ3) | 13.1% | 20.6% |
| Interquartile Range (IQR) | 3.6% | 9.5% |
| Standard Deviation (Sample) | 4.7% | 7.5% |
| Standard Deviation (Population) | 4.6% | 7.5% |
Similar Demographics by Disability
Demographics Similar to Immigrants from Ireland by Disability
In terms of disability, the demographic groups most similar to Immigrants from Ireland are Immigrants from Jordan (11.1%, a difference of 0.050%), Immigrants from Cameroon (11.1%, a difference of 0.080%), Sierra Leonean (11.0%, a difference of 0.12%), Immigrants from Belgium (11.0%, a difference of 0.12%), and Immigrants from Vietnam (11.0%, a difference of 0.15%).
| Demographics | Rating | Rank | Disability |
| Immigrants | Bangladesh | 99.4 /100 | #73 | Exceptional 11.0% |
| Immigrants | Serbia | 99.4 /100 | #74 | Exceptional 11.0% |
| Immigrants | Vietnam | 99.4 /100 | #75 | Exceptional 11.0% |
| Sierra Leoneans | 99.3 /100 | #76 | Exceptional 11.0% |
| Immigrants | Belgium | 99.3 /100 | #77 | Exceptional 11.0% |
| Immigrants | Cameroon | 99.3 /100 | #78 | Exceptional 11.1% |
| Immigrants | Jordan | 99.3 /100 | #79 | Exceptional 11.1% |
| Immigrants | Ireland | 99.3 /100 | #80 | Exceptional 11.1% |
| Immigrants | Poland | 99.1 /100 | #81 | Exceptional 11.1% |
| Chileans | 99.1 /100 | #82 | Exceptional 11.1% |
| Immigrants | Switzerland | 99.0 /100 | #83 | Exceptional 11.1% |
| Immigrants | Sierra Leone | 99.0 /100 | #84 | Exceptional 11.1% |
| Immigrants | Belarus | 98.9 /100 | #85 | Exceptional 11.1% |
| Immigrants | Russia | 98.9 /100 | #86 | Exceptional 11.1% |
| Palestinians | 98.9 /100 | #87 | Exceptional 11.1% |
Demographics Similar to Panamanians by Disability
In terms of disability, the demographic groups most similar to Panamanians are Immigrants from North America (12.1%, a difference of 0.010%), Immigrants from Jamaica (12.1%, a difference of 0.070%), Croatian (12.1%, a difference of 0.11%), Immigrants from Canada (12.1%, a difference of 0.15%), and Immigrants from Bahamas (12.1%, a difference of 0.16%).
| Demographics | Rating | Rank | Disability |
| Danes | 8.7 /100 | #209 | Tragic 12.0% |
| Czechs | 7.9 /100 | #210 | Tragic 12.0% |
| Immigrants | Cambodia | 7.3 /100 | #211 | Tragic 12.0% |
| Austrians | 7.2 /100 | #212 | Tragic 12.0% |
| Immigrants | Iraq | 7.1 /100 | #213 | Tragic 12.0% |
| Immigrants | Somalia | 6.8 /100 | #214 | Tragic 12.0% |
| Immigrants | Canada | 6.1 /100 | #215 | Tragic 12.1% |
| Panamanians | 5.4 /100 | #216 | Tragic 12.1% |
| Immigrants | North America | 5.3 /100 | #217 | Tragic 12.1% |
| Immigrants | Jamaica | 5.0 /100 | #218 | Tragic 12.1% |
| Croatians | 4.9 /100 | #219 | Tragic 12.1% |
| Immigrants | Bahamas | 4.7 /100 | #220 | Tragic 12.1% |
| Northern Europeans | 4.2 /100 | #221 | Tragic 12.1% |
| Spanish American Indians | 4.1 /100 | #222 | Tragic 12.1% |
| Hispanics or Latinos | 3.9 /100 | #223 | Tragic 12.1% |