Immigrants from Trinidad and Tobago vs Panamanian Disability
COMPARE
Immigrants from Trinidad and Tobago
Panamanian
Disability
Disability Comparison
Immigrants from Trinidad and Tobago
Panamanians
11.7%
DISABILITY
58.9/ 100
METRIC RATING
163rd/ 347
METRIC RANK
12.1%
DISABILITY
5.4/ 100
METRIC RATING
216th/ 347
METRIC RANK
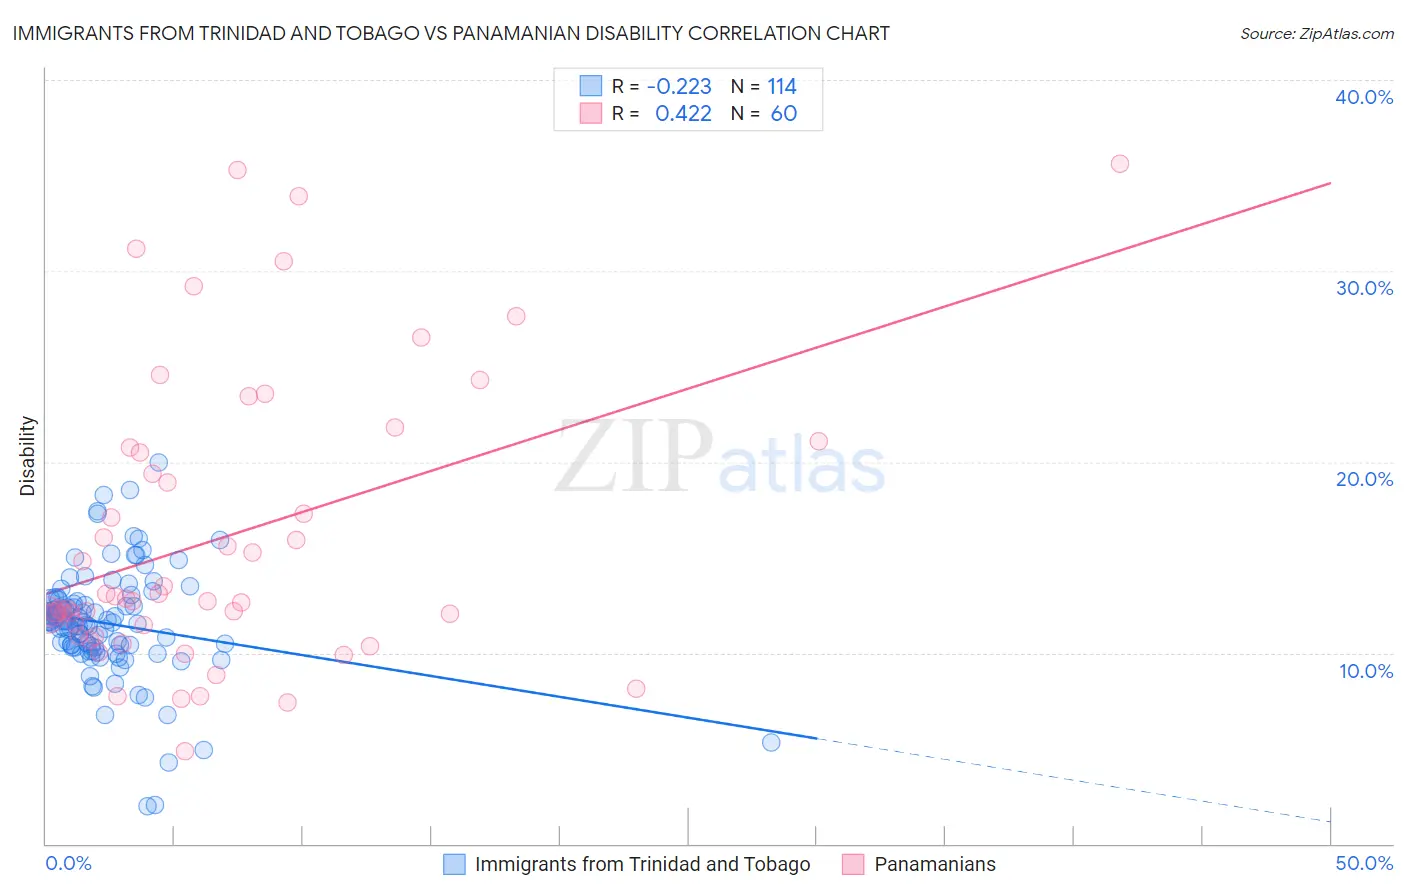
Immigrants from Trinidad and Tobago vs Panamanian Disability Correlation Chart
The statistical analysis conducted on geographies consisting of 223,506,024 people shows a weak negative correlation between the proportion of Immigrants from Trinidad and Tobago and percentage of population with a disability in the United States with a correlation coefficient (R) of -0.223 and weighted average of 11.7%. Similarly, the statistical analysis conducted on geographies consisting of 281,200,623 people shows a moderate positive correlation between the proportion of Panamanians and percentage of population with a disability in the United States with a correlation coefficient (R) of 0.422 and weighted average of 12.1%, a difference of 3.6%.
Disability Correlation Summary
| Measurement | Immigrants from Trinidad and Tobago | Panamanian |
| Minimum | 2.0% | 4.8% |
| Maximum | 20.0% | 35.6% |
| Range | 18.0% | 30.8% |
| Mean | 11.5% | 16.1% |
| Median | 11.6% | 12.8% |
| Interquartile 25% (IQ1) | 10.3% | 11.2% |
| Interquartile 75% (IQ3) | 12.7% | 20.6% |
| Interquartile Range (IQR) | 2.5% | 9.5% |
| Standard Deviation (Sample) | 2.9% | 7.5% |
| Standard Deviation (Population) | 2.9% | 7.5% |
Similar Demographics by Disability
Demographics Similar to Immigrants from Trinidad and Tobago by Disability
In terms of disability, the demographic groups most similar to Immigrants from Trinidad and Tobago are Immigrants from Haiti (11.7%, a difference of 0.020%), Syrian (11.7%, a difference of 0.020%), Cuban (11.7%, a difference of 0.10%), Immigrants from Cuba (11.6%, a difference of 0.19%), and Pakistani (11.7%, a difference of 0.19%).
| Demographics | Rating | Rank | Disability |
| Immigrants | Fiji | 69.5 /100 | #156 | Good 11.6% |
| Immigrants | Middle Africa | 69.5 /100 | #157 | Good 11.6% |
| Armenians | 65.9 /100 | #158 | Good 11.6% |
| Guatemalans | 65.1 /100 | #159 | Good 11.6% |
| Immigrants | Barbados | 64.2 /100 | #160 | Good 11.6% |
| Immigrants | Cuba | 62.8 /100 | #161 | Good 11.6% |
| Immigrants | Haiti | 59.2 /100 | #162 | Average 11.7% |
| Immigrants | Trinidad and Tobago | 58.9 /100 | #163 | Average 11.7% |
| Syrians | 58.5 /100 | #164 | Average 11.7% |
| Cubans | 56.7 /100 | #165 | Average 11.7% |
| Pakistanis | 54.7 /100 | #166 | Average 11.7% |
| Estonians | 54.4 /100 | #167 | Average 11.7% |
| Immigrants | Latin America | 54.1 /100 | #168 | Average 11.7% |
| Immigrants | Austria | 53.4 /100 | #169 | Average 11.7% |
| Immigrants | Albania | 52.8 /100 | #170 | Average 11.7% |
Demographics Similar to Panamanians by Disability
In terms of disability, the demographic groups most similar to Panamanians are Immigrants from North America (12.1%, a difference of 0.010%), Immigrants from Jamaica (12.1%, a difference of 0.070%), Croatian (12.1%, a difference of 0.11%), Immigrants from Canada (12.1%, a difference of 0.15%), and Immigrants from Bahamas (12.1%, a difference of 0.16%).
| Demographics | Rating | Rank | Disability |
| Danes | 8.7 /100 | #209 | Tragic 12.0% |
| Czechs | 7.9 /100 | #210 | Tragic 12.0% |
| Immigrants | Cambodia | 7.3 /100 | #211 | Tragic 12.0% |
| Austrians | 7.2 /100 | #212 | Tragic 12.0% |
| Immigrants | Iraq | 7.1 /100 | #213 | Tragic 12.0% |
| Immigrants | Somalia | 6.8 /100 | #214 | Tragic 12.0% |
| Immigrants | Canada | 6.1 /100 | #215 | Tragic 12.1% |
| Panamanians | 5.4 /100 | #216 | Tragic 12.1% |
| Immigrants | North America | 5.3 /100 | #217 | Tragic 12.1% |
| Immigrants | Jamaica | 5.0 /100 | #218 | Tragic 12.1% |
| Croatians | 4.9 /100 | #219 | Tragic 12.1% |
| Immigrants | Bahamas | 4.7 /100 | #220 | Tragic 12.1% |
| Northern Europeans | 4.2 /100 | #221 | Tragic 12.1% |
| Spanish American Indians | 4.1 /100 | #222 | Tragic 12.1% |
| Hispanics or Latinos | 3.9 /100 | #223 | Tragic 12.1% |