Immigrants from Romania vs Icelander Ambulatory Disability
COMPARE
Immigrants from Romania
Icelander
Ambulatory Disability
Ambulatory Disability Comparison
Immigrants from Romania
Icelanders
5.8%
AMBULATORY DISABILITY
97.7/ 100
METRIC RATING
103rd/ 347
METRIC RANK
5.9%
AMBULATORY DISABILITY
92.6/ 100
METRIC RATING
122nd/ 347
METRIC RANK
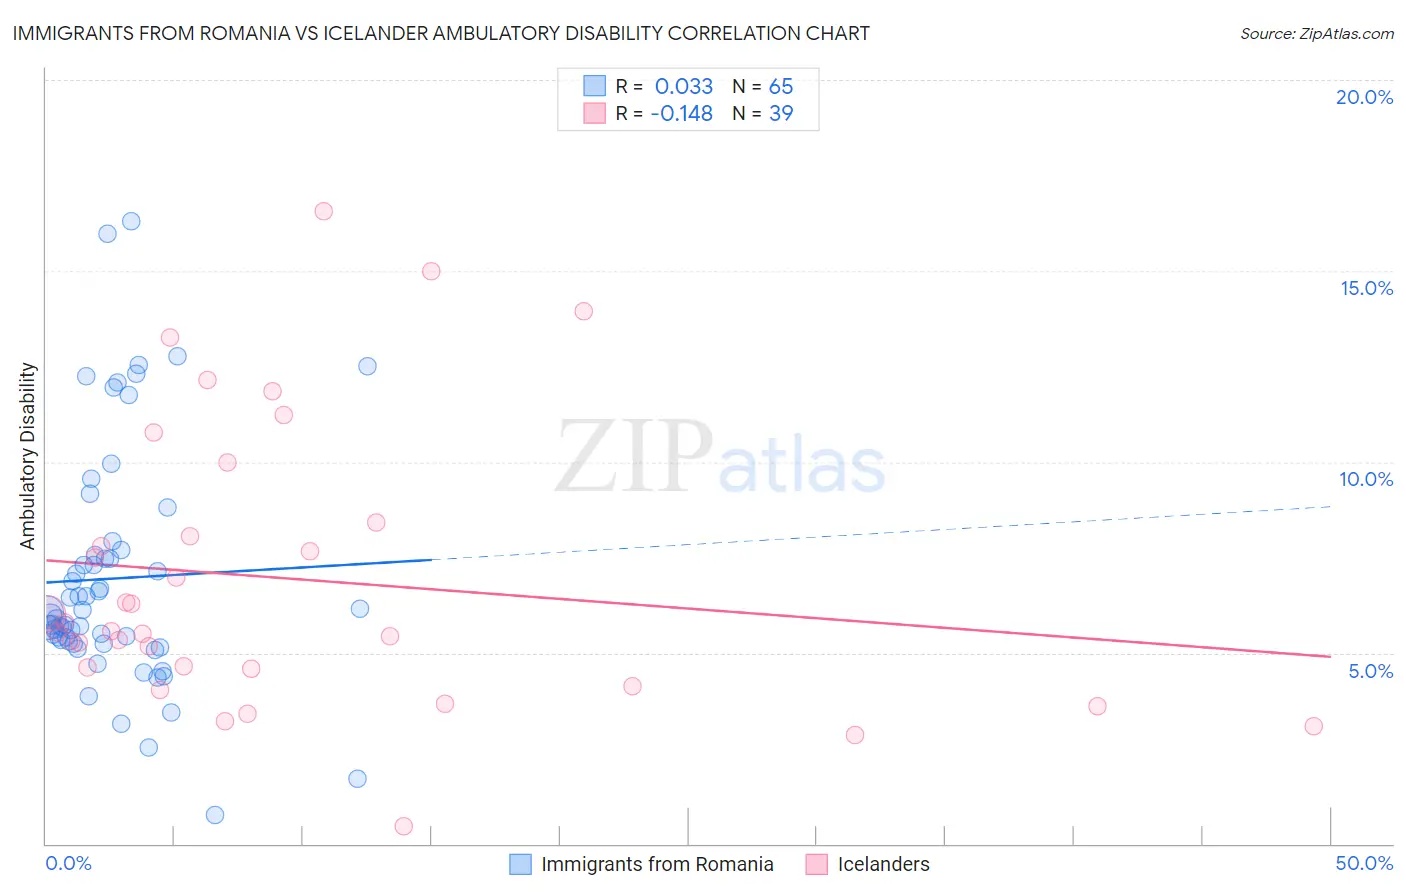
Immigrants from Romania vs Icelander Ambulatory Disability Correlation Chart
The statistical analysis conducted on geographies consisting of 256,972,629 people shows no correlation between the proportion of Immigrants from Romania and percentage of population with ambulatory disability in the United States with a correlation coefficient (R) of 0.033 and weighted average of 5.8%. Similarly, the statistical analysis conducted on geographies consisting of 159,642,692 people shows a poor negative correlation between the proportion of Icelanders and percentage of population with ambulatory disability in the United States with a correlation coefficient (R) of -0.148 and weighted average of 5.9%, a difference of 1.7%.
Ambulatory Disability Correlation Summary
| Measurement | Immigrants from Romania | Icelander |
| Minimum | 0.77% | 0.47% |
| Maximum | 16.3% | 16.5% |
| Range | 15.5% | 16.1% |
| Mean | 6.9% | 6.9% |
| Median | 6.0% | 5.6% |
| Interquartile 25% (IQ1) | 5.3% | 4.6% |
| Interquartile 75% (IQ3) | 7.6% | 8.4% |
| Interquartile Range (IQR) | 2.4% | 3.8% |
| Standard Deviation (Sample) | 3.1% | 3.7% |
| Standard Deviation (Population) | 3.1% | 3.7% |
Demographics Similar to Immigrants from Romania and Icelanders by Ambulatory Disability
In terms of ambulatory disability, the demographic groups most similar to Immigrants from Romania are New Zealander (5.8%, a difference of 0.060%), Immigrants from Kenya (5.8%, a difference of 0.070%), Immigrants from Czechoslovakia (5.8%, a difference of 0.17%), Immigrants from Morocco (5.8%, a difference of 0.24%), and Uruguayan (5.8%, a difference of 0.29%). Similarly, the demographic groups most similar to Icelanders are Costa Rican (5.9%, a difference of 0.0%), Estonian (5.9%, a difference of 0.070%), Norwegian (5.9%, a difference of 0.11%), Russian (5.9%, a difference of 0.18%), and Immigrants from South Eastern Asia (5.9%, a difference of 0.22%).
| Demographics | Rating | Rank | Ambulatory Disability |
| Immigrants | Kenya | 97.8 /100 | #102 | Exceptional 5.8% |
| Immigrants | Romania | 97.7 /100 | #103 | Exceptional 5.8% |
| New Zealanders | 97.6 /100 | #104 | Exceptional 5.8% |
| Immigrants | Czechoslovakia | 97.4 /100 | #105 | Exceptional 5.8% |
| Immigrants | Morocco | 97.3 /100 | #106 | Exceptional 5.8% |
| Uruguayans | 97.2 /100 | #107 | Exceptional 5.8% |
| Colombians | 97.2 /100 | #108 | Exceptional 5.8% |
| Immigrants | Netherlands | 97.1 /100 | #109 | Exceptional 5.8% |
| Immigrants | Colombia | 96.7 /100 | #110 | Exceptional 5.8% |
| Danes | 96.6 /100 | #111 | Exceptional 5.8% |
| South Africans | 96.3 /100 | #112 | Exceptional 5.9% |
| Immigrants | Uruguay | 95.6 /100 | #113 | Exceptional 5.9% |
| Immigrants | Poland | 95.4 /100 | #114 | Exceptional 5.9% |
| South American Indians | 94.8 /100 | #115 | Exceptional 5.9% |
| Immigrants | Africa | 94.7 /100 | #116 | Exceptional 5.9% |
| Immigrants | South Eastern Asia | 93.6 /100 | #117 | Exceptional 5.9% |
| Russians | 93.4 /100 | #118 | Exceptional 5.9% |
| Norwegians | 93.1 /100 | #119 | Exceptional 5.9% |
| Estonians | 92.9 /100 | #120 | Exceptional 5.9% |
| Costa Ricans | 92.6 /100 | #121 | Exceptional 5.9% |
| Icelanders | 92.6 /100 | #122 | Exceptional 5.9% |