Immigrants from Romania vs Spanish Ambulatory Disability
COMPARE
Immigrants from Romania
Spanish
Ambulatory Disability
Ambulatory Disability Comparison
Immigrants from Romania
Spanish
5.8%
AMBULATORY DISABILITY
97.7/ 100
METRIC RATING
103rd/ 347
METRIC RANK
6.6%
AMBULATORY DISABILITY
0.2/ 100
METRIC RATING
268th/ 347
METRIC RANK
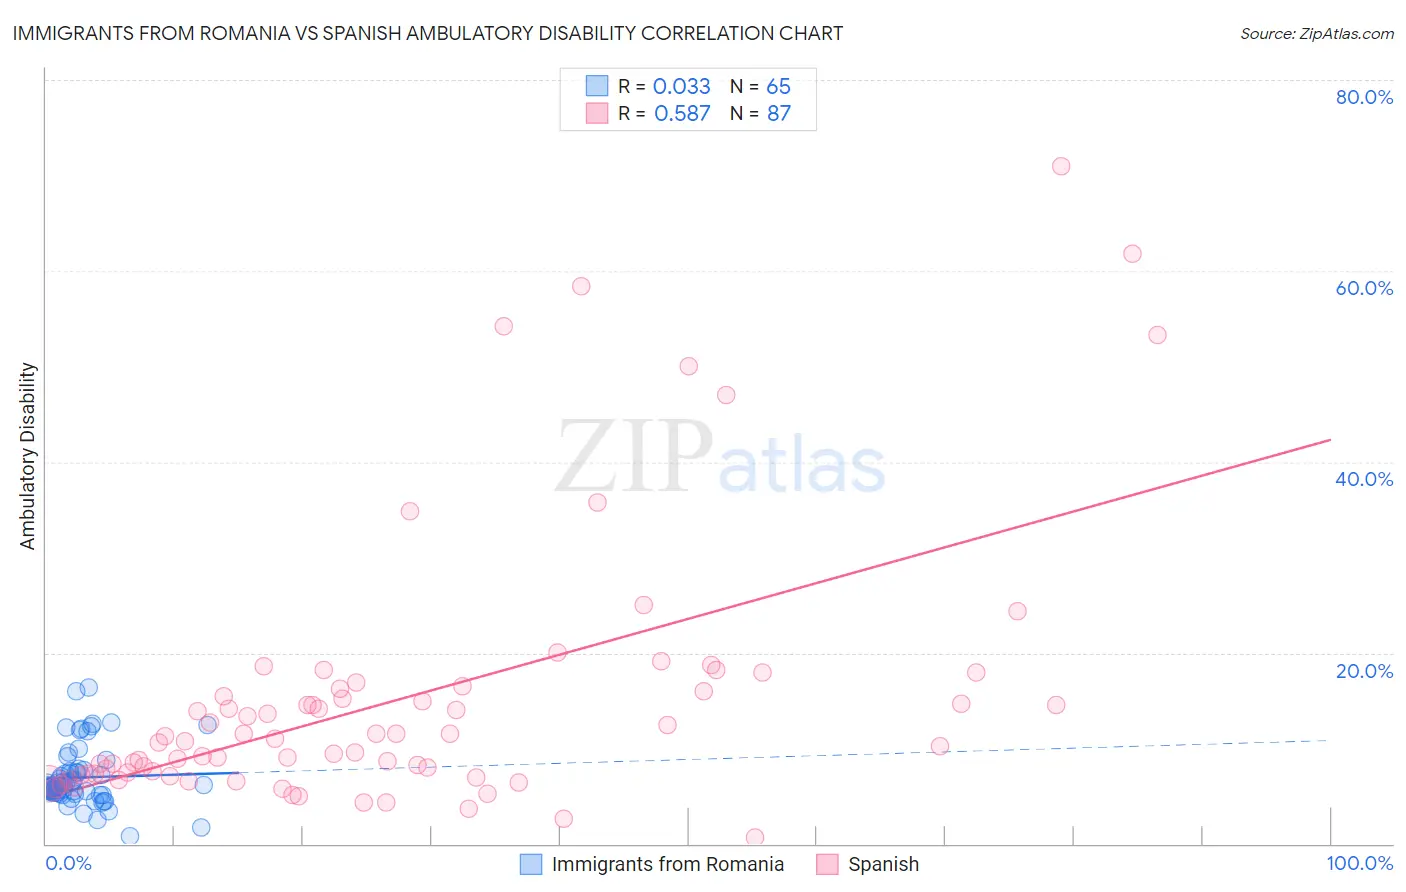
Immigrants from Romania vs Spanish Ambulatory Disability Correlation Chart
The statistical analysis conducted on geographies consisting of 256,972,629 people shows no correlation between the proportion of Immigrants from Romania and percentage of population with ambulatory disability in the United States with a correlation coefficient (R) of 0.033 and weighted average of 5.8%. Similarly, the statistical analysis conducted on geographies consisting of 421,992,199 people shows a substantial positive correlation between the proportion of Spanish and percentage of population with ambulatory disability in the United States with a correlation coefficient (R) of 0.587 and weighted average of 6.6%, a difference of 14.0%.
Ambulatory Disability Correlation Summary
| Measurement | Immigrants from Romania | Spanish |
| Minimum | 0.77% | 0.68% |
| Maximum | 16.3% | 71.0% |
| Range | 15.5% | 70.3% |
| Mean | 6.9% | 15.1% |
| Median | 6.0% | 11.0% |
| Interquartile 25% (IQ1) | 5.3% | 7.3% |
| Interquartile 75% (IQ3) | 7.6% | 16.2% |
| Interquartile Range (IQR) | 2.4% | 8.9% |
| Standard Deviation (Sample) | 3.1% | 13.9% |
| Standard Deviation (Population) | 3.1% | 13.8% |
Similar Demographics by Ambulatory Disability
Demographics Similar to Immigrants from Romania by Ambulatory Disability
In terms of ambulatory disability, the demographic groups most similar to Immigrants from Romania are New Zealander (5.8%, a difference of 0.060%), Immigrants from Kenya (5.8%, a difference of 0.070%), Immigrants from Serbia (5.8%, a difference of 0.15%), Immigrants from South America (5.8%, a difference of 0.15%), and Immigrants from Czechoslovakia (5.8%, a difference of 0.17%).
| Demographics | Rating | Rank | Ambulatory Disability |
| Salvadorans | 98.4 /100 | #96 | Exceptional 5.8% |
| Immigrants | Somalia | 98.3 /100 | #97 | Exceptional 5.8% |
| Immigrants | Lebanon | 98.3 /100 | #98 | Exceptional 5.8% |
| Immigrants | Northern Europe | 98.2 /100 | #99 | Exceptional 5.8% |
| Immigrants | Serbia | 97.9 /100 | #100 | Exceptional 5.8% |
| Immigrants | South America | 97.9 /100 | #101 | Exceptional 5.8% |
| Immigrants | Kenya | 97.8 /100 | #102 | Exceptional 5.8% |
| Immigrants | Romania | 97.7 /100 | #103 | Exceptional 5.8% |
| New Zealanders | 97.6 /100 | #104 | Exceptional 5.8% |
| Immigrants | Czechoslovakia | 97.4 /100 | #105 | Exceptional 5.8% |
| Immigrants | Morocco | 97.3 /100 | #106 | Exceptional 5.8% |
| Uruguayans | 97.2 /100 | #107 | Exceptional 5.8% |
| Colombians | 97.2 /100 | #108 | Exceptional 5.8% |
| Immigrants | Netherlands | 97.1 /100 | #109 | Exceptional 5.8% |
| Immigrants | Colombia | 96.7 /100 | #110 | Exceptional 5.8% |
Demographics Similar to Spanish by Ambulatory Disability
In terms of ambulatory disability, the demographic groups most similar to Spanish are Trinidadian and Tobagonian (6.6%, a difference of 0.020%), Guyanese (6.6%, a difference of 0.14%), Bahamian (6.6%, a difference of 0.26%), French (6.6%, a difference of 0.31%), and Nepalese (6.6%, a difference of 0.33%).
| Demographics | Rating | Rank | Ambulatory Disability |
| Irish | 0.4 /100 | #261 | Tragic 6.6% |
| English | 0.4 /100 | #262 | Tragic 6.6% |
| Hmong | 0.3 /100 | #263 | Tragic 6.6% |
| Nepalese | 0.2 /100 | #264 | Tragic 6.6% |
| Bahamians | 0.2 /100 | #265 | Tragic 6.6% |
| Guyanese | 0.2 /100 | #266 | Tragic 6.6% |
| Trinidadians and Tobagonians | 0.2 /100 | #267 | Tragic 6.6% |
| Spanish | 0.2 /100 | #268 | Tragic 6.6% |
| French | 0.1 /100 | #269 | Tragic 6.6% |
| Slovaks | 0.1 /100 | #270 | Tragic 6.7% |
| Immigrants | Trinidad and Tobago | 0.1 /100 | #271 | Tragic 6.7% |
| French Canadians | 0.1 /100 | #272 | Tragic 6.7% |
| Whites/Caucasians | 0.1 /100 | #273 | Tragic 6.7% |
| Sioux | 0.1 /100 | #274 | Tragic 6.7% |
| Immigrants | Guyana | 0.1 /100 | #275 | Tragic 6.7% |