Guyanese vs Icelander Ambulatory Disability
COMPARE
Guyanese
Icelander
Ambulatory Disability
Ambulatory Disability Comparison
Guyanese
Icelanders
6.6%
AMBULATORY DISABILITY
0.2/ 100
METRIC RATING
266th/ 347
METRIC RANK
5.9%
AMBULATORY DISABILITY
92.6/ 100
METRIC RATING
122nd/ 347
METRIC RANK
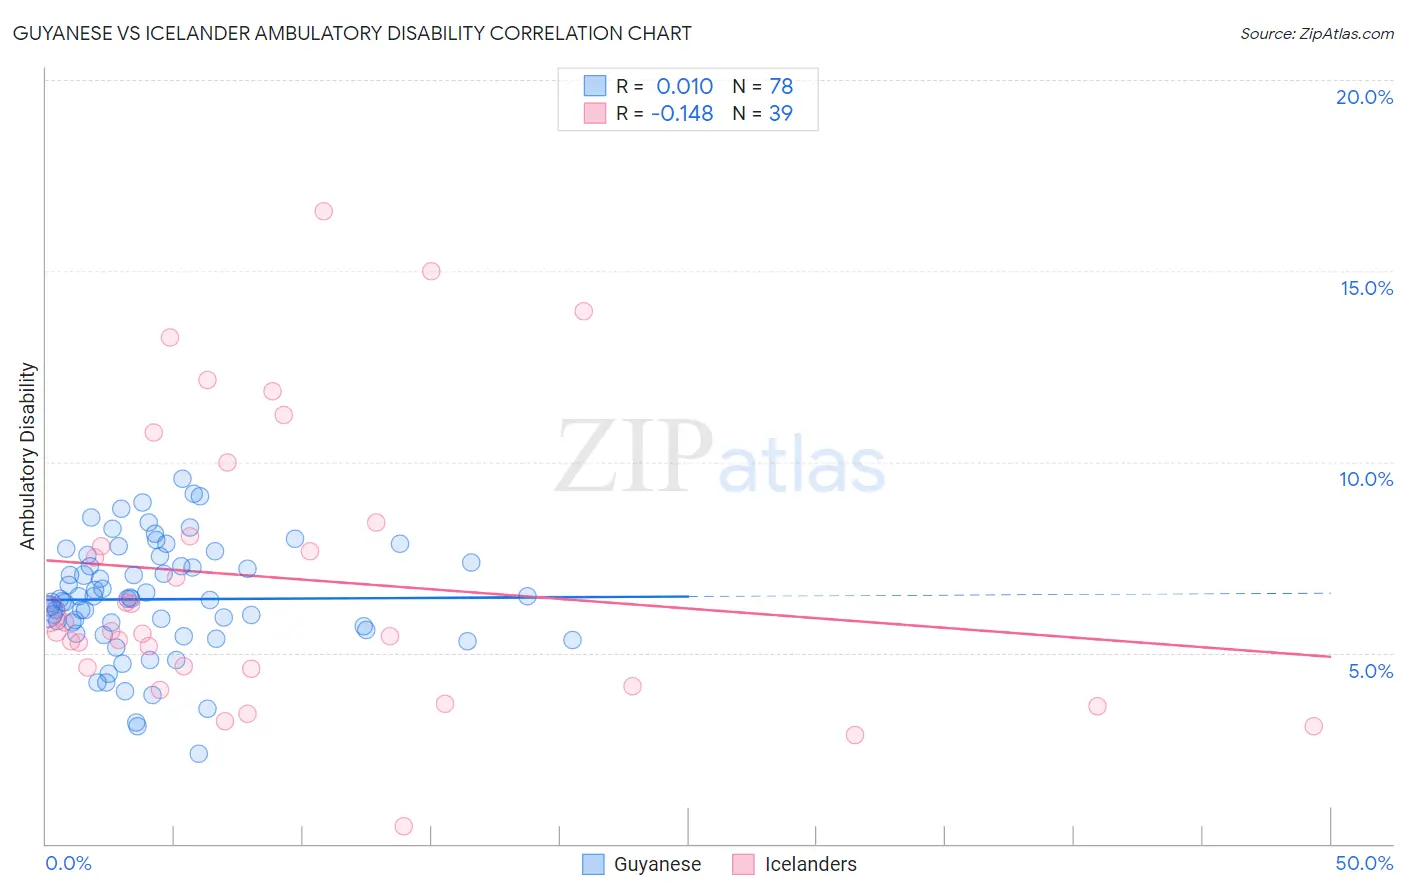
Guyanese vs Icelander Ambulatory Disability Correlation Chart
The statistical analysis conducted on geographies consisting of 176,872,924 people shows no correlation between the proportion of Guyanese and percentage of population with ambulatory disability in the United States with a correlation coefficient (R) of 0.010 and weighted average of 6.6%. Similarly, the statistical analysis conducted on geographies consisting of 159,642,692 people shows a poor negative correlation between the proportion of Icelanders and percentage of population with ambulatory disability in the United States with a correlation coefficient (R) of -0.148 and weighted average of 5.9%, a difference of 11.9%.
Ambulatory Disability Correlation Summary
| Measurement | Guyanese | Icelander |
| Minimum | 2.4% | 0.47% |
| Maximum | 9.5% | 16.5% |
| Range | 7.2% | 16.1% |
| Mean | 6.4% | 6.9% |
| Median | 6.4% | 5.6% |
| Interquartile 25% (IQ1) | 5.6% | 4.6% |
| Interquartile 75% (IQ3) | 7.4% | 8.4% |
| Interquartile Range (IQR) | 1.8% | 3.8% |
| Standard Deviation (Sample) | 1.5% | 3.7% |
| Standard Deviation (Population) | 1.5% | 3.7% |
Similar Demographics by Ambulatory Disability
Demographics Similar to Guyanese by Ambulatory Disability
In terms of ambulatory disability, the demographic groups most similar to Guyanese are Bahamian (6.6%, a difference of 0.12%), Trinidadian and Tobagonian (6.6%, a difference of 0.13%), Spanish (6.6%, a difference of 0.14%), Nepalese (6.6%, a difference of 0.18%), and French (6.6%, a difference of 0.45%).
| Demographics | Rating | Rank | Ambulatory Disability |
| Aleuts | 0.4 /100 | #259 | Tragic 6.6% |
| Immigrants | Belize | 0.4 /100 | #260 | Tragic 6.6% |
| Irish | 0.4 /100 | #261 | Tragic 6.6% |
| English | 0.4 /100 | #262 | Tragic 6.6% |
| Hmong | 0.3 /100 | #263 | Tragic 6.6% |
| Nepalese | 0.2 /100 | #264 | Tragic 6.6% |
| Bahamians | 0.2 /100 | #265 | Tragic 6.6% |
| Guyanese | 0.2 /100 | #266 | Tragic 6.6% |
| Trinidadians and Tobagonians | 0.2 /100 | #267 | Tragic 6.6% |
| Spanish | 0.2 /100 | #268 | Tragic 6.6% |
| French | 0.1 /100 | #269 | Tragic 6.6% |
| Slovaks | 0.1 /100 | #270 | Tragic 6.7% |
| Immigrants | Trinidad and Tobago | 0.1 /100 | #271 | Tragic 6.7% |
| French Canadians | 0.1 /100 | #272 | Tragic 6.7% |
| Whites/Caucasians | 0.1 /100 | #273 | Tragic 6.7% |
Demographics Similar to Icelanders by Ambulatory Disability
In terms of ambulatory disability, the demographic groups most similar to Icelanders are Costa Rican (5.9%, a difference of 0.0%), Immigrants from Russia (5.9%, a difference of 0.020%), Immigrants from Middle Africa (5.9%, a difference of 0.060%), Estonian (5.9%, a difference of 0.070%), and Norwegian (5.9%, a difference of 0.11%).
| Demographics | Rating | Rank | Ambulatory Disability |
| South American Indians | 94.8 /100 | #115 | Exceptional 5.9% |
| Immigrants | Africa | 94.7 /100 | #116 | Exceptional 5.9% |
| Immigrants | South Eastern Asia | 93.6 /100 | #117 | Exceptional 5.9% |
| Russians | 93.4 /100 | #118 | Exceptional 5.9% |
| Norwegians | 93.1 /100 | #119 | Exceptional 5.9% |
| Estonians | 92.9 /100 | #120 | Exceptional 5.9% |
| Costa Ricans | 92.6 /100 | #121 | Exceptional 5.9% |
| Icelanders | 92.6 /100 | #122 | Exceptional 5.9% |
| Immigrants | Russia | 92.4 /100 | #123 | Exceptional 5.9% |
| Immigrants | Middle Africa | 92.2 /100 | #124 | Exceptional 5.9% |
| Koreans | 91.6 /100 | #125 | Exceptional 5.9% |
| Arabs | 91.5 /100 | #126 | Exceptional 5.9% |
| Immigrants | Nigeria | 90.9 /100 | #127 | Exceptional 5.9% |
| Immigrants | Western Asia | 90.7 /100 | #128 | Exceptional 5.9% |
| Immigrants | Norway | 90.5 /100 | #129 | Exceptional 5.9% |