Immigrants from Romania vs Basque Ambulatory Disability
COMPARE
Immigrants from Romania
Basque
Ambulatory Disability
Ambulatory Disability Comparison
Immigrants from Romania
Basques
5.8%
AMBULATORY DISABILITY
97.7/ 100
METRIC RATING
103rd/ 347
METRIC RANK
6.1%
AMBULATORY DISABILITY
63.7/ 100
METRIC RATING
164th/ 347
METRIC RANK
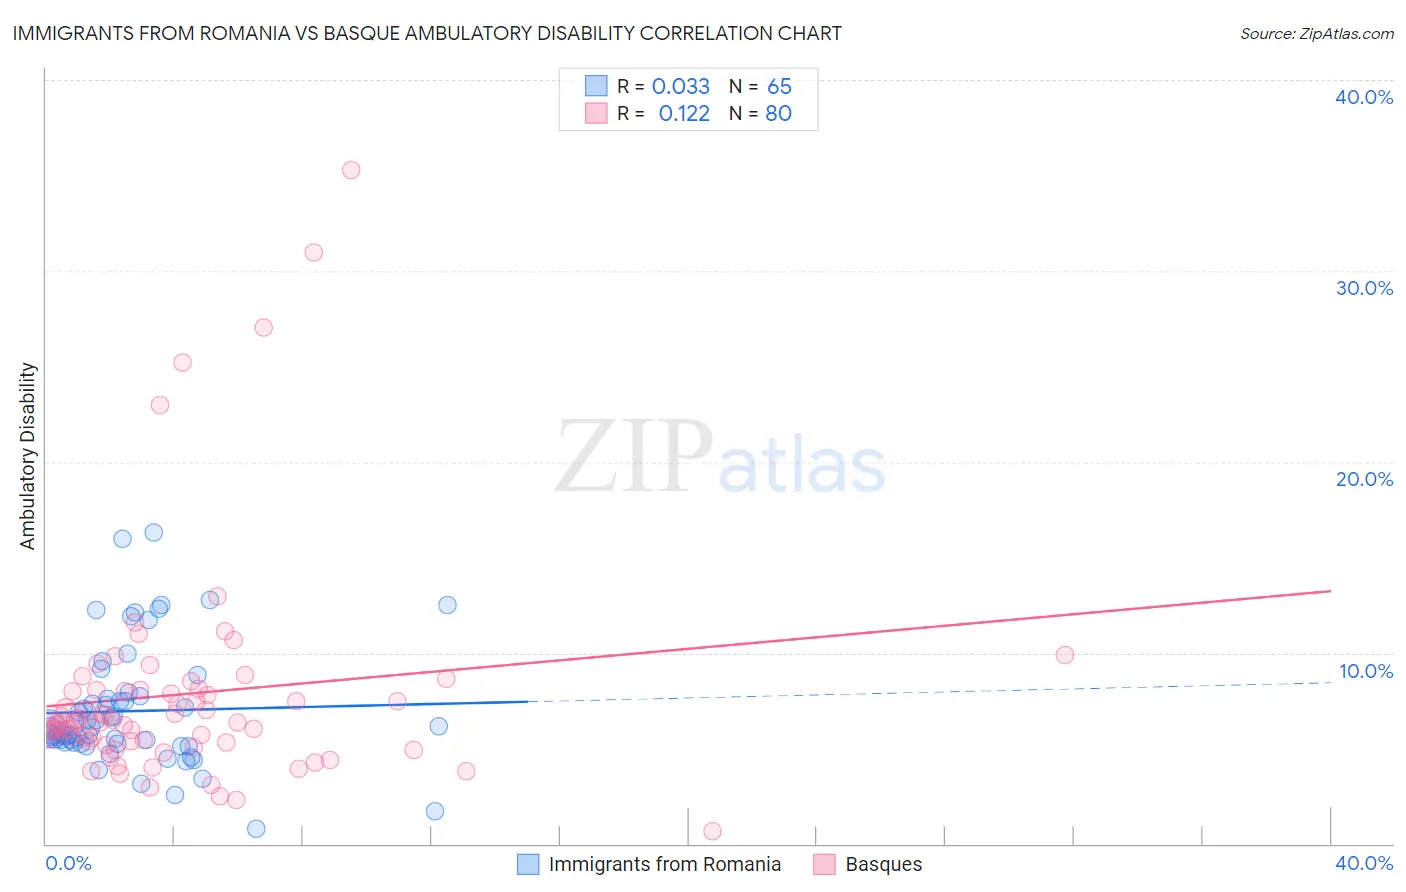
Immigrants from Romania vs Basque Ambulatory Disability Correlation Chart
The statistical analysis conducted on geographies consisting of 256,972,629 people shows no correlation between the proportion of Immigrants from Romania and percentage of population with ambulatory disability in the United States with a correlation coefficient (R) of 0.033 and weighted average of 5.8%. Similarly, the statistical analysis conducted on geographies consisting of 165,766,481 people shows a poor positive correlation between the proportion of Basques and percentage of population with ambulatory disability in the United States with a correlation coefficient (R) of 0.122 and weighted average of 6.1%, a difference of 4.4%.
Ambulatory Disability Correlation Summary
| Measurement | Immigrants from Romania | Basque |
| Minimum | 0.77% | 0.67% |
| Maximum | 16.3% | 35.3% |
| Range | 15.5% | 34.6% |
| Mean | 6.9% | 7.8% |
| Median | 6.0% | 6.4% |
| Interquartile 25% (IQ1) | 5.3% | 5.3% |
| Interquartile 75% (IQ3) | 7.6% | 8.0% |
| Interquartile Range (IQR) | 2.4% | 2.7% |
| Standard Deviation (Sample) | 3.1% | 5.8% |
| Standard Deviation (Population) | 3.1% | 5.8% |
Similar Demographics by Ambulatory Disability
Demographics Similar to Immigrants from Romania by Ambulatory Disability
In terms of ambulatory disability, the demographic groups most similar to Immigrants from Romania are New Zealander (5.8%, a difference of 0.060%), Immigrants from Kenya (5.8%, a difference of 0.070%), Immigrants from Serbia (5.8%, a difference of 0.15%), Immigrants from South America (5.8%, a difference of 0.15%), and Immigrants from Czechoslovakia (5.8%, a difference of 0.17%).
| Demographics | Rating | Rank | Ambulatory Disability |
| Salvadorans | 98.4 /100 | #96 | Exceptional 5.8% |
| Immigrants | Somalia | 98.3 /100 | #97 | Exceptional 5.8% |
| Immigrants | Lebanon | 98.3 /100 | #98 | Exceptional 5.8% |
| Immigrants | Northern Europe | 98.2 /100 | #99 | Exceptional 5.8% |
| Immigrants | Serbia | 97.9 /100 | #100 | Exceptional 5.8% |
| Immigrants | South America | 97.9 /100 | #101 | Exceptional 5.8% |
| Immigrants | Kenya | 97.8 /100 | #102 | Exceptional 5.8% |
| Immigrants | Romania | 97.7 /100 | #103 | Exceptional 5.8% |
| New Zealanders | 97.6 /100 | #104 | Exceptional 5.8% |
| Immigrants | Czechoslovakia | 97.4 /100 | #105 | Exceptional 5.8% |
| Immigrants | Morocco | 97.3 /100 | #106 | Exceptional 5.8% |
| Uruguayans | 97.2 /100 | #107 | Exceptional 5.8% |
| Colombians | 97.2 /100 | #108 | Exceptional 5.8% |
| Immigrants | Netherlands | 97.1 /100 | #109 | Exceptional 5.8% |
| Immigrants | Colombia | 96.7 /100 | #110 | Exceptional 5.8% |
Demographics Similar to Basques by Ambulatory Disability
In terms of ambulatory disability, the demographic groups most similar to Basques are Nicaraguan (6.1%, a difference of 0.030%), Iraqi (6.1%, a difference of 0.050%), Lebanese (6.1%, a difference of 0.15%), Immigrants from Oceania (6.1%, a difference of 0.17%), and Ecuadorian (6.1%, a difference of 0.18%).
| Demographics | Rating | Rank | Ambulatory Disability |
| Ghanaians | 71.3 /100 | #157 | Good 6.0% |
| Immigrants | Fiji | 71.2 /100 | #158 | Good 6.0% |
| Immigrants | Latvia | 71.1 /100 | #159 | Good 6.0% |
| Central Americans | 69.8 /100 | #160 | Good 6.0% |
| Immigrants | Belarus | 69.2 /100 | #161 | Good 6.1% |
| Nigerians | 67.1 /100 | #162 | Good 6.1% |
| Lebanese | 66.2 /100 | #163 | Good 6.1% |
| Basques | 63.7 /100 | #164 | Good 6.1% |
| Nicaraguans | 63.2 /100 | #165 | Good 6.1% |
| Iraqis | 62.8 /100 | #166 | Good 6.1% |
| Immigrants | Oceania | 60.7 /100 | #167 | Good 6.1% |
| Ecuadorians | 60.5 /100 | #168 | Good 6.1% |
| Immigrants | Southern Europe | 58.1 /100 | #169 | Average 6.1% |
| Immigrants | Ecuador | 53.8 /100 | #170 | Average 6.1% |
| Moroccans | 52.6 /100 | #171 | Average 6.1% |