Arab vs Macedonian Male Disability
COMPARE
Arab
Macedonian
Male Disability
Male Disability Comparison
Arabs
Macedonians
11.0%
MALE DISABILITY
81.5/ 100
METRIC RATING
141st/ 347
METRIC RANK
11.0%
MALE DISABILITY
84.2/ 100
METRIC RATING
131st/ 347
METRIC RANK
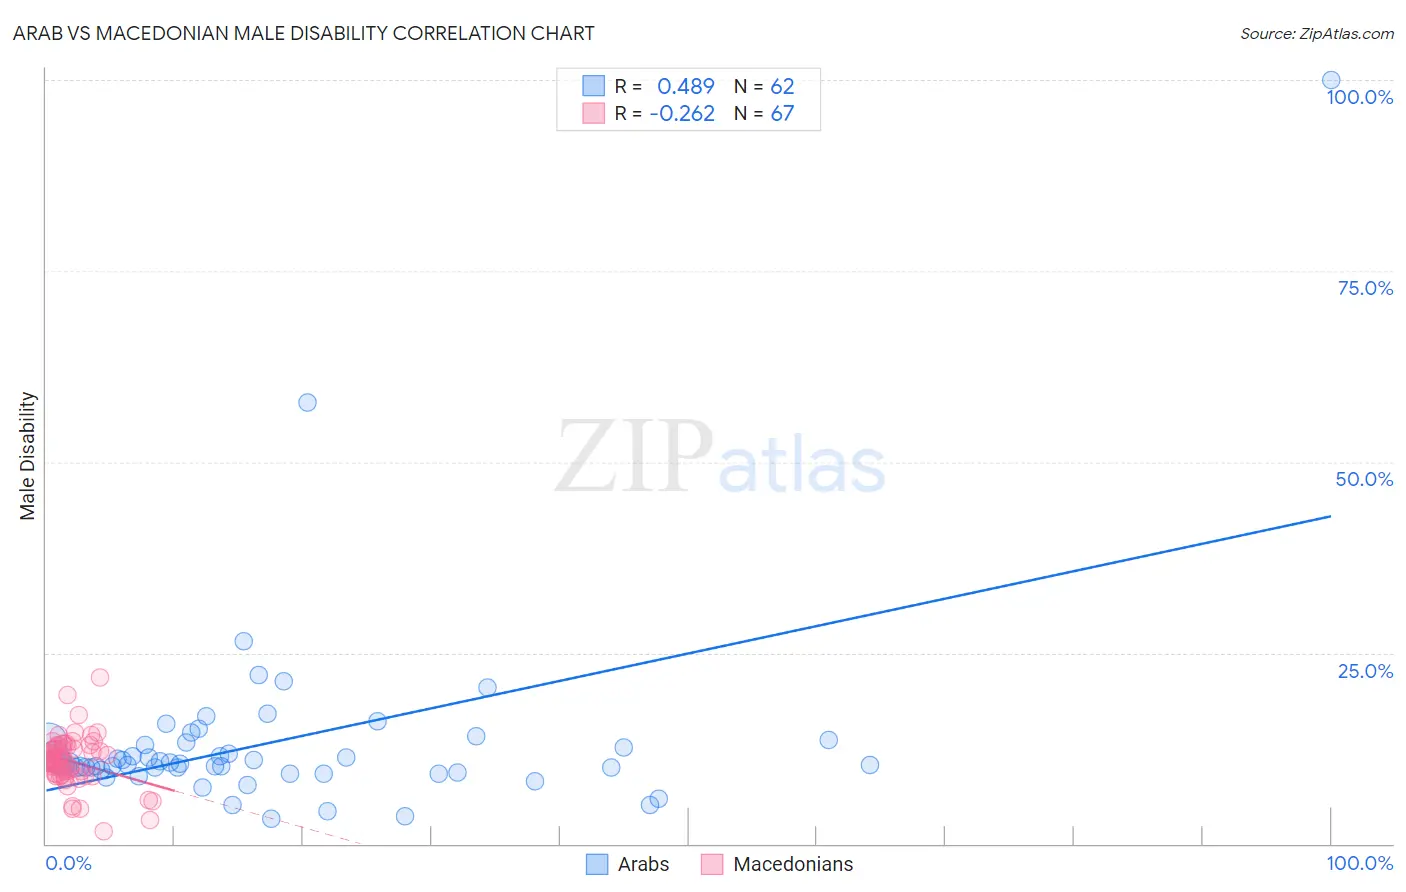
Arab vs Macedonian Male Disability Correlation Chart
The statistical analysis conducted on geographies consisting of 486,768,170 people shows a moderate positive correlation between the proportion of Arabs and percentage of males with a disability in the United States with a correlation coefficient (R) of 0.489 and weighted average of 11.0%. Similarly, the statistical analysis conducted on geographies consisting of 132,656,892 people shows a weak negative correlation between the proportion of Macedonians and percentage of males with a disability in the United States with a correlation coefficient (R) of -0.262 and weighted average of 11.0%, a difference of 0.27%.
Male Disability Correlation Summary
| Measurement | Arab | Macedonian |
| Minimum | 3.3% | 1.6% |
| Maximum | 100.0% | 21.7% |
| Range | 96.7% | 20.1% |
| Mean | 13.5% | 10.8% |
| Median | 10.5% | 11.0% |
| Interquartile 25% (IQ1) | 9.6% | 9.1% |
| Interquartile 75% (IQ3) | 13.2% | 12.7% |
| Interquartile Range (IQR) | 3.6% | 3.6% |
| Standard Deviation (Sample) | 13.3% | 3.3% |
| Standard Deviation (Population) | 13.2% | 3.3% |
Demographics Similar to Arabs and Macedonians by Male Disability
In terms of male disability, the demographic groups most similar to Arabs are Immigrants from Italy (11.0%, a difference of 0.0%), Immigrants from Sudan (11.0%, a difference of 0.0%), South African (11.0%, a difference of 0.020%), Nigerian (11.0%, a difference of 0.040%), and Immigrants from Europe (11.0%, a difference of 0.050%). Similarly, the demographic groups most similar to Macedonians are Immigrants from Fiji (11.0%, a difference of 0.020%), Ugandan (11.0%, a difference of 0.030%), Bhutanese (11.0%, a difference of 0.080%), Trinidadian and Tobagonian (11.0%, a difference of 0.10%), and Immigrants from Latvia (10.9%, a difference of 0.14%).
| Demographics | Rating | Rank | Male Disability |
| Immigrants | Trinidad and Tobago | 86.9 /100 | #126 | Excellent 10.9% |
| Immigrants | Ukraine | 86.8 /100 | #127 | Excellent 10.9% |
| Immigrants | Latvia | 85.5 /100 | #128 | Excellent 10.9% |
| Immigrants | Philippines | 85.4 /100 | #129 | Excellent 10.9% |
| Brazilians | 85.4 /100 | #130 | Excellent 10.9% |
| Macedonians | 84.2 /100 | #131 | Excellent 11.0% |
| Immigrants | Fiji | 84.0 /100 | #132 | Excellent 11.0% |
| Ugandans | 83.9 /100 | #133 | Excellent 11.0% |
| Bhutanese | 83.4 /100 | #134 | Excellent 11.0% |
| Trinidadians and Tobagonians | 83.3 /100 | #135 | Excellent 11.0% |
| Immigrants | Costa Rica | 82.8 /100 | #136 | Excellent 11.0% |
| Immigrants | Europe | 82.0 /100 | #137 | Excellent 11.0% |
| Nigerians | 81.9 /100 | #138 | Excellent 11.0% |
| South Africans | 81.7 /100 | #139 | Excellent 11.0% |
| Immigrants | Italy | 81.5 /100 | #140 | Excellent 11.0% |
| Arabs | 81.5 /100 | #141 | Excellent 11.0% |
| Immigrants | Sudan | 81.5 /100 | #142 | Excellent 11.0% |
| Moroccans | 80.7 /100 | #143 | Excellent 11.0% |
| Kenyans | 78.1 /100 | #144 | Good 11.0% |
| Costa Ricans | 78.0 /100 | #145 | Good 11.0% |
| Koreans | 77.5 /100 | #146 | Good 11.0% |