Immigrants from Poland vs Immigrants from Kenya College, Under 1 year
COMPARE
Immigrants from Poland
Immigrants from Kenya
College, Under 1 year
College, Under 1 year Comparison
Immigrants from Poland
Immigrants from Kenya
65.2%
COLLEGE, UNDER 1 YEAR
42.6/ 100
METRIC RATING
183rd/ 347
METRIC RANK
66.5%
COLLEGE, UNDER 1 YEAR
81.8/ 100
METRIC RATING
145th/ 347
METRIC RANK
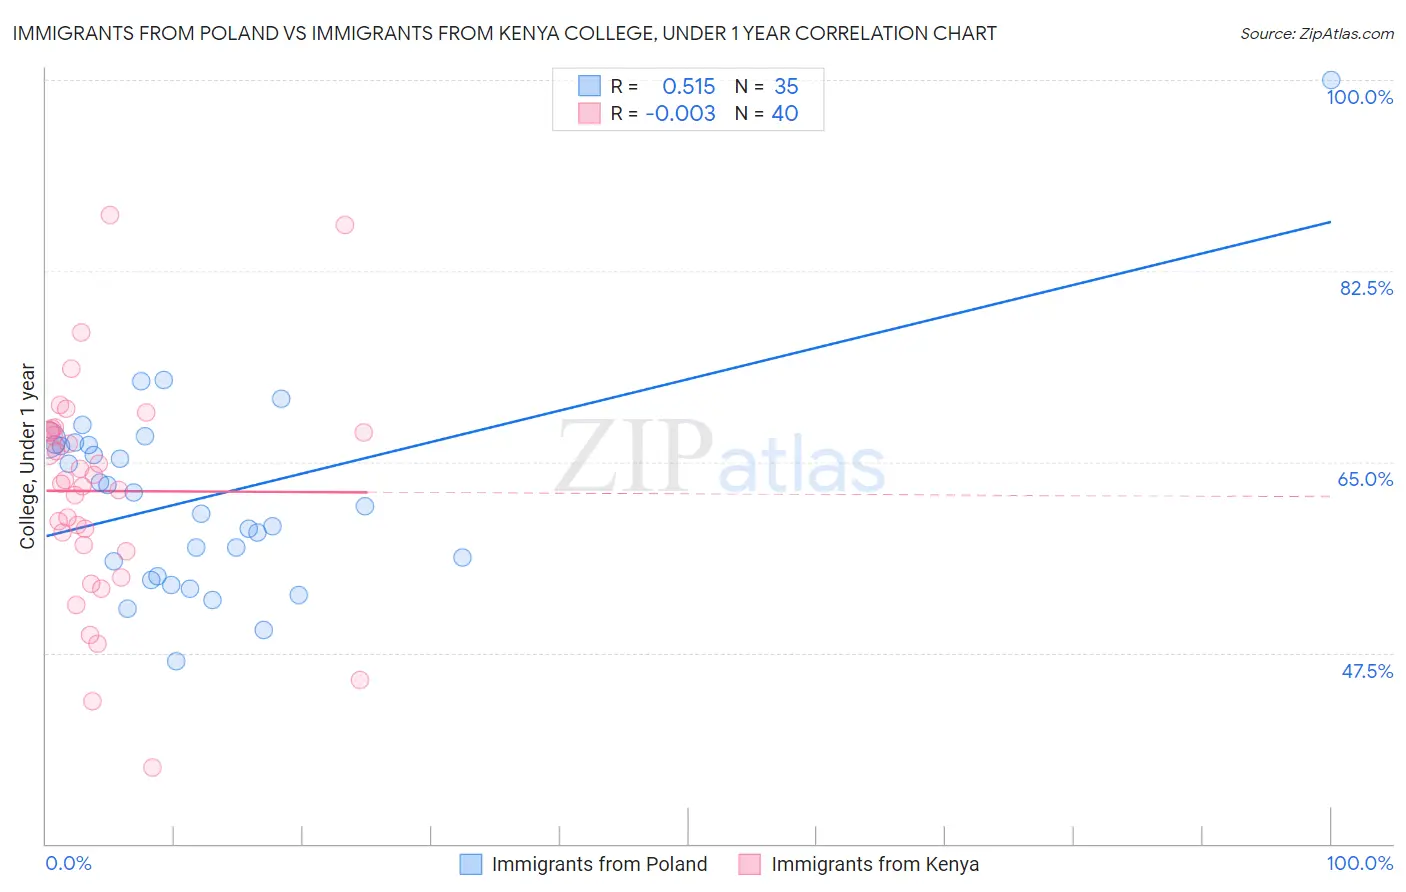
Immigrants from Poland vs Immigrants from Kenya College, Under 1 year Correlation Chart
The statistical analysis conducted on geographies consisting of 304,861,877 people shows a substantial positive correlation between the proportion of Immigrants from Poland and percentage of population with at least college, under 1 year education in the United States with a correlation coefficient (R) of 0.515 and weighted average of 65.2%. Similarly, the statistical analysis conducted on geographies consisting of 218,085,582 people shows no correlation between the proportion of Immigrants from Kenya and percentage of population with at least college, under 1 year education in the United States with a correlation coefficient (R) of -0.003 and weighted average of 66.5%, a difference of 2.0%.
College, Under 1 year Correlation Summary
| Measurement | Immigrants from Poland | Immigrants from Kenya |
| Minimum | 46.7% | 37.0% |
| Maximum | 100.0% | 87.6% |
| Range | 53.3% | 50.6% |
| Mean | 61.8% | 62.3% |
| Median | 61.0% | 63.2% |
| Interquartile 25% (IQ1) | 54.6% | 57.1% |
| Interquartile 75% (IQ3) | 66.6% | 67.8% |
| Interquartile Range (IQR) | 12.0% | 10.7% |
| Standard Deviation (Sample) | 9.4% | 10.3% |
| Standard Deviation (Population) | 9.3% | 10.1% |
Similar Demographics by College, Under 1 year
Demographics Similar to Immigrants from Poland by College, Under 1 year
In terms of college, under 1 year, the demographic groups most similar to Immigrants from Poland are Bermudan (65.2%, a difference of 0.030%), Sri Lankan (65.2%, a difference of 0.040%), Immigrants from Africa (65.3%, a difference of 0.10%), Spaniard (65.3%, a difference of 0.13%), and Immigrants from Sierra Leone (65.1%, a difference of 0.13%).
| Demographics | Rating | Rank | College, Under 1 year |
| French | 48.9 /100 | #176 | Average 65.4% |
| Immigrants | North Macedonia | 48.6 /100 | #177 | Average 65.4% |
| German Russians | 48.3 /100 | #178 | Average 65.4% |
| Guamanians/Chamorros | 48.2 /100 | #179 | Average 65.4% |
| Dutch | 46.1 /100 | #180 | Average 65.3% |
| Spaniards | 45.5 /100 | #181 | Average 65.3% |
| Immigrants | Africa | 44.7 /100 | #182 | Average 65.3% |
| Immigrants | Poland | 42.6 /100 | #183 | Average 65.2% |
| Bermudans | 42.0 /100 | #184 | Average 65.2% |
| Sri Lankans | 41.7 /100 | #185 | Average 65.2% |
| Immigrants | Sierra Leone | 39.7 /100 | #186 | Fair 65.1% |
| Immigrants | Southern Europe | 34.3 /100 | #187 | Fair 64.9% |
| Immigrants | Albania | 32.0 /100 | #188 | Fair 64.9% |
| Spanish | 31.6 /100 | #189 | Fair 64.9% |
| Immigrants | Philippines | 30.1 /100 | #190 | Fair 64.8% |
Demographics Similar to Immigrants from Kenya by College, Under 1 year
In terms of college, under 1 year, the demographic groups most similar to Immigrants from Kenya are Kenyan (66.5%, a difference of 0.0%), Immigrants from Germany (66.5%, a difference of 0.010%), Immigrants from Morocco (66.5%, a difference of 0.010%), Immigrants from Uganda (66.5%, a difference of 0.070%), and English (66.6%, a difference of 0.090%).
| Demographics | Rating | Rank | College, Under 1 year |
| Immigrants | Italy | 86.9 /100 | #138 | Excellent 66.8% |
| Venezuelans | 85.9 /100 | #139 | Excellent 66.7% |
| Slavs | 85.9 /100 | #140 | Excellent 66.7% |
| Immigrants | Afghanistan | 85.1 /100 | #141 | Excellent 66.7% |
| English | 82.9 /100 | #142 | Excellent 66.6% |
| Immigrants | Uganda | 82.8 /100 | #143 | Excellent 66.5% |
| Immigrants | Germany | 82.0 /100 | #144 | Excellent 66.5% |
| Immigrants | Kenya | 81.8 /100 | #145 | Excellent 66.5% |
| Kenyans | 81.7 /100 | #146 | Excellent 66.5% |
| Immigrants | Morocco | 81.7 /100 | #147 | Excellent 66.5% |
| Taiwanese | 78.6 /100 | #148 | Good 66.4% |
| Immigrants | Venezuela | 77.9 /100 | #149 | Good 66.3% |
| Immigrants | Iraq | 77.1 /100 | #150 | Good 66.3% |
| Immigrants | Sudan | 76.0 /100 | #151 | Good 66.2% |
| Sudanese | 74.1 /100 | #152 | Good 66.2% |