Immigrants from Philippines vs Alaska Native Disability
COMPARE
Immigrants from Philippines
Alaska Native
Disability
Disability Comparison
Immigrants from Philippines
Alaska Natives
11.3%
DISABILITY
94.6/ 100
METRIC RATING
115th/ 347
METRIC RANK
13.2%
DISABILITY
0.0/ 100
METRIC RATING
298th/ 347
METRIC RANK
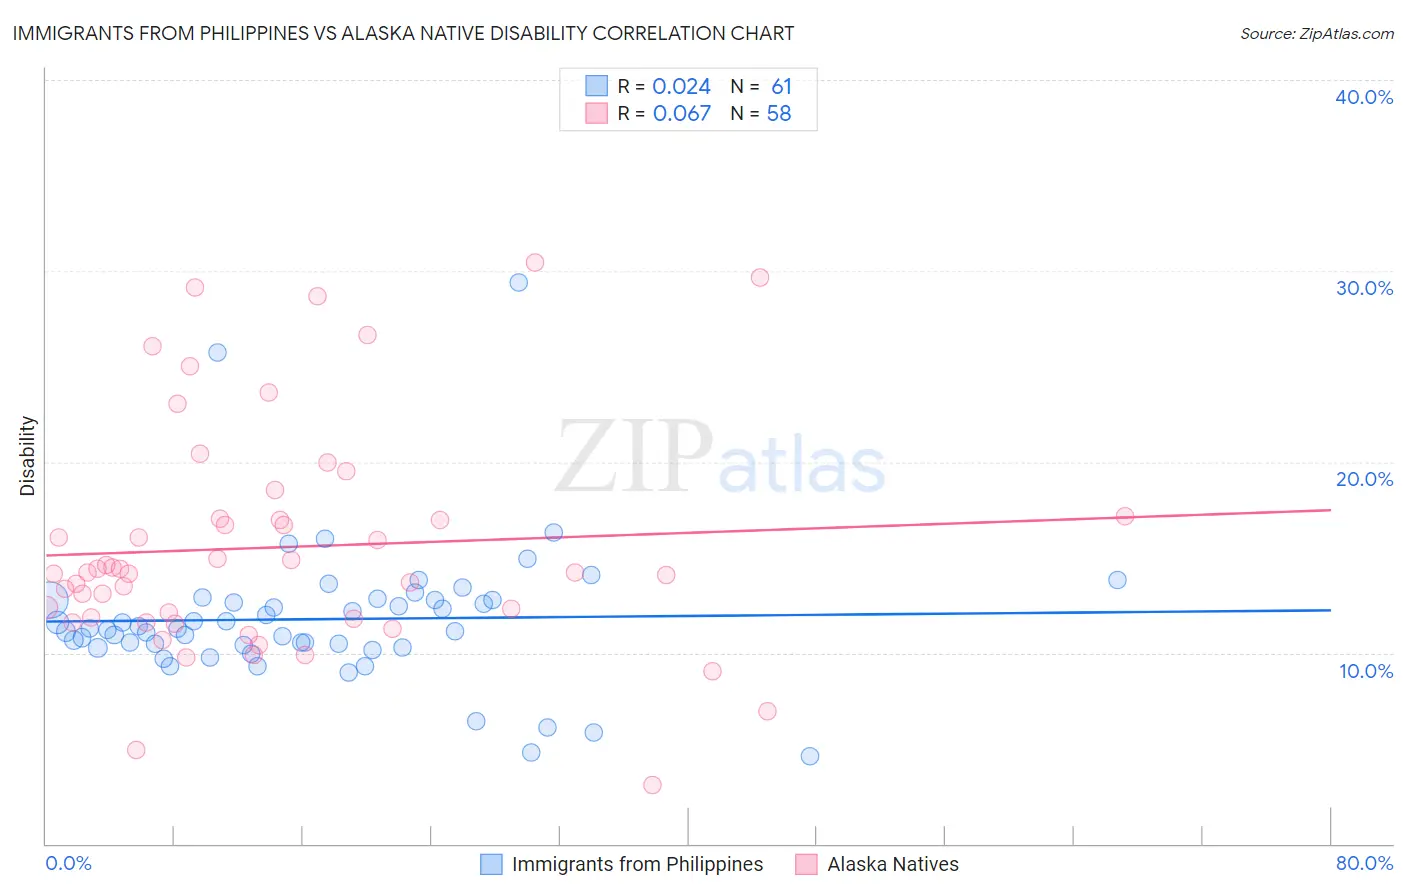
Immigrants from Philippines vs Alaska Native Disability Correlation Chart
The statistical analysis conducted on geographies consisting of 471,195,487 people shows no correlation between the proportion of Immigrants from Philippines and percentage of population with a disability in the United States with a correlation coefficient (R) of 0.024 and weighted average of 11.3%. Similarly, the statistical analysis conducted on geographies consisting of 76,775,228 people shows a slight positive correlation between the proportion of Alaska Natives and percentage of population with a disability in the United States with a correlation coefficient (R) of 0.067 and weighted average of 13.2%, a difference of 16.2%.
Disability Correlation Summary
| Measurement | Immigrants from Philippines | Alaska Native |
| Minimum | 4.6% | 3.1% |
| Maximum | 29.4% | 30.4% |
| Range | 24.8% | 27.4% |
| Mean | 11.8% | 15.5% |
| Median | 11.3% | 14.2% |
| Interquartile 25% (IQ1) | 10.4% | 11.8% |
| Interquartile 75% (IQ3) | 12.8% | 17.0% |
| Interquartile Range (IQR) | 2.4% | 5.2% |
| Standard Deviation (Sample) | 3.8% | 6.0% |
| Standard Deviation (Population) | 3.8% | 5.9% |
Similar Demographics by Disability
Demographics Similar to Immigrants from Philippines by Disability
In terms of disability, the demographic groups most similar to Immigrants from Philippines are Immigrants from Syria (11.3%, a difference of 0.010%), Guyanese (11.3%, a difference of 0.020%), Immigrants from Uzbekistan (11.3%, a difference of 0.060%), Immigrants from Northern Europe (11.3%, a difference of 0.11%), and Luxembourger (11.3%, a difference of 0.17%).
| Demographics | Rating | Rank | Disability |
| Immigrants | Nigeria | 96.0 /100 | #108 | Exceptional 11.3% |
| Immigrants | Uganda | 95.7 /100 | #109 | Exceptional 11.3% |
| Immigrants | Denmark | 95.6 /100 | #110 | Exceptional 11.3% |
| Immigrants | South Eastern Asia | 95.4 /100 | #111 | Exceptional 11.3% |
| Immigrants | Uzbekistan | 94.9 /100 | #112 | Exceptional 11.3% |
| Guyanese | 94.7 /100 | #113 | Exceptional 11.3% |
| Immigrants | Syria | 94.7 /100 | #114 | Exceptional 11.3% |
| Immigrants | Philippines | 94.6 /100 | #115 | Exceptional 11.3% |
| Immigrants | Northern Europe | 94.1 /100 | #116 | Exceptional 11.3% |
| Luxembourgers | 93.9 /100 | #117 | Exceptional 11.3% |
| Koreans | 93.8 /100 | #118 | Exceptional 11.3% |
| Central Americans | 93.5 /100 | #119 | Exceptional 11.4% |
| Immigrants | North Macedonia | 93.5 /100 | #120 | Exceptional 11.4% |
| Immigrants | Costa Rica | 93.4 /100 | #121 | Exceptional 11.4% |
| Brazilians | 93.3 /100 | #122 | Exceptional 11.4% |
Demographics Similar to Alaska Natives by Disability
In terms of disability, the demographic groups most similar to Alaska Natives are Hopi (13.2%, a difference of 0.010%), French (13.2%, a difference of 0.020%), Central American Indian (13.2%, a difference of 0.070%), Pennsylvania German (13.2%, a difference of 0.070%), and Nonimmigrants (13.2%, a difference of 0.11%).
| Demographics | Rating | Rank | Disability |
| Yaqui | 0.0 /100 | #291 | Tragic 13.1% |
| Aleuts | 0.0 /100 | #292 | Tragic 13.1% |
| Marshallese | 0.0 /100 | #293 | Tragic 13.1% |
| Celtics | 0.0 /100 | #294 | Tragic 13.1% |
| Immigrants | Nonimmigrants | 0.0 /100 | #295 | Tragic 13.2% |
| Central American Indians | 0.0 /100 | #296 | Tragic 13.2% |
| Hopi | 0.0 /100 | #297 | Tragic 13.2% |
| Alaska Natives | 0.0 /100 | #298 | Tragic 13.2% |
| French | 0.0 /100 | #299 | Tragic 13.2% |
| Pennsylvania Germans | 0.0 /100 | #300 | Tragic 13.2% |
| Immigrants | Micronesia | 0.0 /100 | #301 | Tragic 13.2% |
| Arapaho | 0.0 /100 | #302 | Tragic 13.2% |
| Scotch-Irish | 0.0 /100 | #303 | Tragic 13.3% |
| Yakama | 0.0 /100 | #304 | Tragic 13.4% |
| French Canadians | 0.0 /100 | #305 | Tragic 13.4% |