Immigrants from Oceania vs Alaska Native Disability
COMPARE
Immigrants from Oceania
Alaska Native
Disability
Disability Comparison
Immigrants from Oceania
Alaska Natives
11.8%
DISABILITY
34.3/ 100
METRIC RATING
181st/ 347
METRIC RANK
13.2%
DISABILITY
0.0/ 100
METRIC RATING
298th/ 347
METRIC RANK
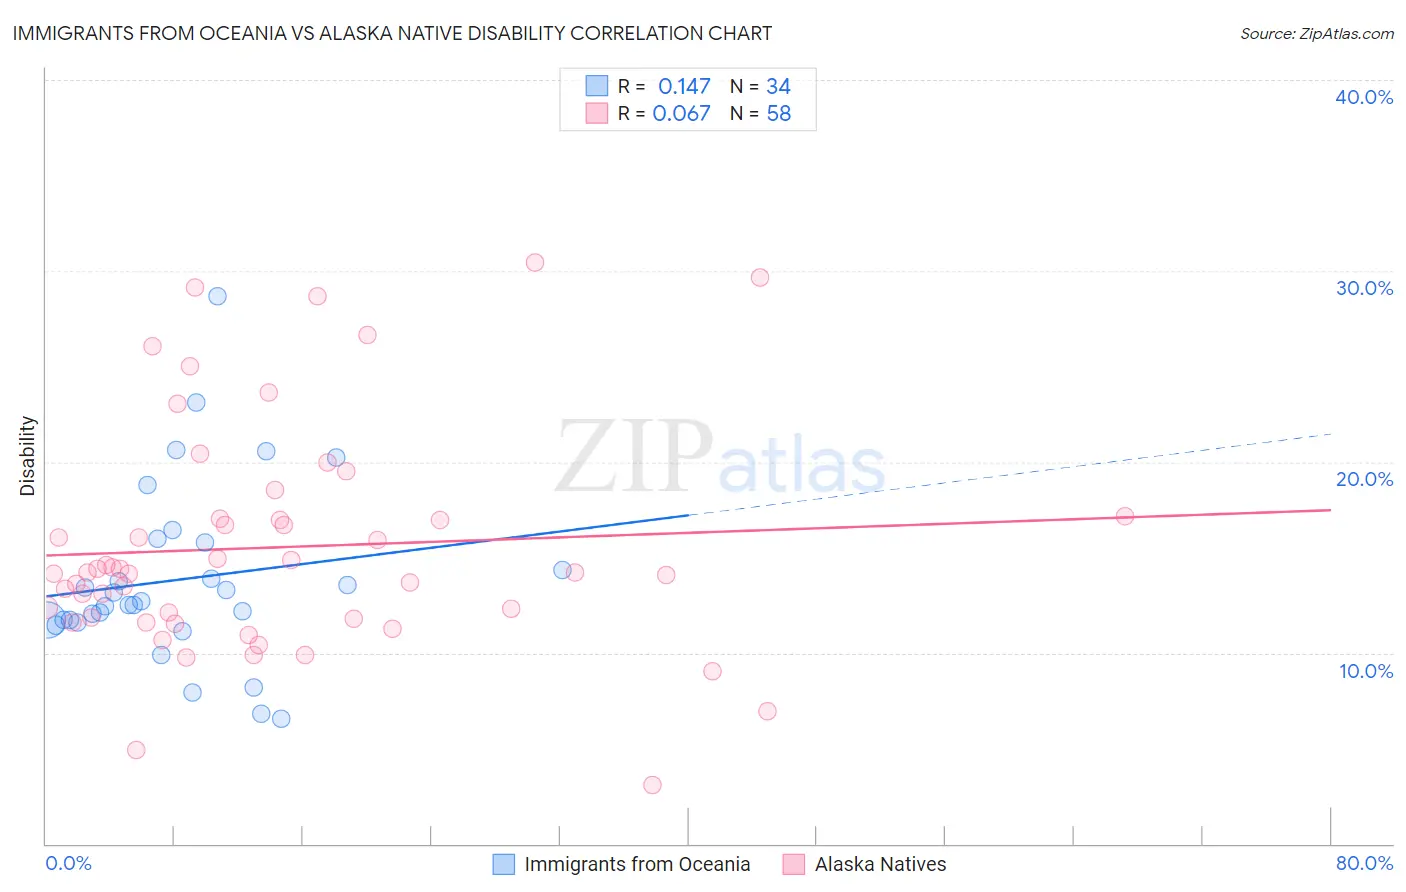
Immigrants from Oceania vs Alaska Native Disability Correlation Chart
The statistical analysis conducted on geographies consisting of 305,494,892 people shows a poor positive correlation between the proportion of Immigrants from Oceania and percentage of population with a disability in the United States with a correlation coefficient (R) of 0.147 and weighted average of 11.8%. Similarly, the statistical analysis conducted on geographies consisting of 76,775,228 people shows a slight positive correlation between the proportion of Alaska Natives and percentage of population with a disability in the United States with a correlation coefficient (R) of 0.067 and weighted average of 13.2%, a difference of 11.7%.
Disability Correlation Summary
| Measurement | Immigrants from Oceania | Alaska Native |
| Minimum | 6.6% | 3.1% |
| Maximum | 28.7% | 30.4% |
| Range | 22.1% | 27.4% |
| Mean | 13.8% | 15.5% |
| Median | 12.6% | 14.2% |
| Interquartile 25% (IQ1) | 11.7% | 11.8% |
| Interquartile 75% (IQ3) | 15.8% | 17.0% |
| Interquartile Range (IQR) | 4.1% | 5.2% |
| Standard Deviation (Sample) | 4.6% | 6.0% |
| Standard Deviation (Population) | 4.6% | 5.9% |
Similar Demographics by Disability
Demographics Similar to Immigrants from Oceania by Disability
In terms of disability, the demographic groups most similar to Immigrants from Oceania are Icelander (11.8%, a difference of 0.010%), Honduran (11.8%, a difference of 0.15%), Immigrants from Honduras (11.8%, a difference of 0.17%), Iraqi (11.8%, a difference of 0.21%), and Immigrants from Burma/Myanmar (11.8%, a difference of 0.30%).
| Demographics | Rating | Rank | Disability |
| Albanians | 50.0 /100 | #174 | Average 11.7% |
| Haitians | 48.6 /100 | #175 | Average 11.7% |
| Immigrants | Western Africa | 47.5 /100 | #176 | Average 11.7% |
| Immigrants | Central America | 46.6 /100 | #177 | Average 11.7% |
| Greeks | 46.2 /100 | #178 | Average 11.7% |
| Immigrants | Armenia | 41.9 /100 | #179 | Average 11.7% |
| Immigrants | Honduras | 37.8 /100 | #180 | Fair 11.8% |
| Immigrants | Oceania | 34.3 /100 | #181 | Fair 11.8% |
| Icelanders | 34.0 /100 | #182 | Fair 11.8% |
| Hondurans | 31.2 /100 | #183 | Fair 11.8% |
| Iraqis | 30.0 /100 | #184 | Fair 11.8% |
| Immigrants | Burma/Myanmar | 28.5 /100 | #185 | Fair 11.8% |
| Immigrants | Scotland | 28.2 /100 | #186 | Fair 11.8% |
| Lebanese | 27.9 /100 | #187 | Fair 11.8% |
| Immigrants | Mexico | 23.8 /100 | #188 | Fair 11.9% |
Demographics Similar to Alaska Natives by Disability
In terms of disability, the demographic groups most similar to Alaska Natives are Hopi (13.2%, a difference of 0.010%), French (13.2%, a difference of 0.020%), Central American Indian (13.2%, a difference of 0.070%), Pennsylvania German (13.2%, a difference of 0.070%), and Nonimmigrants (13.2%, a difference of 0.11%).
| Demographics | Rating | Rank | Disability |
| Yaqui | 0.0 /100 | #291 | Tragic 13.1% |
| Aleuts | 0.0 /100 | #292 | Tragic 13.1% |
| Marshallese | 0.0 /100 | #293 | Tragic 13.1% |
| Celtics | 0.0 /100 | #294 | Tragic 13.1% |
| Immigrants | Nonimmigrants | 0.0 /100 | #295 | Tragic 13.2% |
| Central American Indians | 0.0 /100 | #296 | Tragic 13.2% |
| Hopi | 0.0 /100 | #297 | Tragic 13.2% |
| Alaska Natives | 0.0 /100 | #298 | Tragic 13.2% |
| French | 0.0 /100 | #299 | Tragic 13.2% |
| Pennsylvania Germans | 0.0 /100 | #300 | Tragic 13.2% |
| Immigrants | Micronesia | 0.0 /100 | #301 | Tragic 13.2% |
| Arapaho | 0.0 /100 | #302 | Tragic 13.2% |
| Scotch-Irish | 0.0 /100 | #303 | Tragic 13.3% |
| Yakama | 0.0 /100 | #304 | Tragic 13.4% |
| French Canadians | 0.0 /100 | #305 | Tragic 13.4% |