South American vs Alaska Native Disability
COMPARE
South American
Alaska Native
Disability
Disability Comparison
South Americans
Alaska Natives
10.9%
DISABILITY
99.8/ 100
METRIC RATING
52nd/ 347
METRIC RANK
13.2%
DISABILITY
0.0/ 100
METRIC RATING
298th/ 347
METRIC RANK
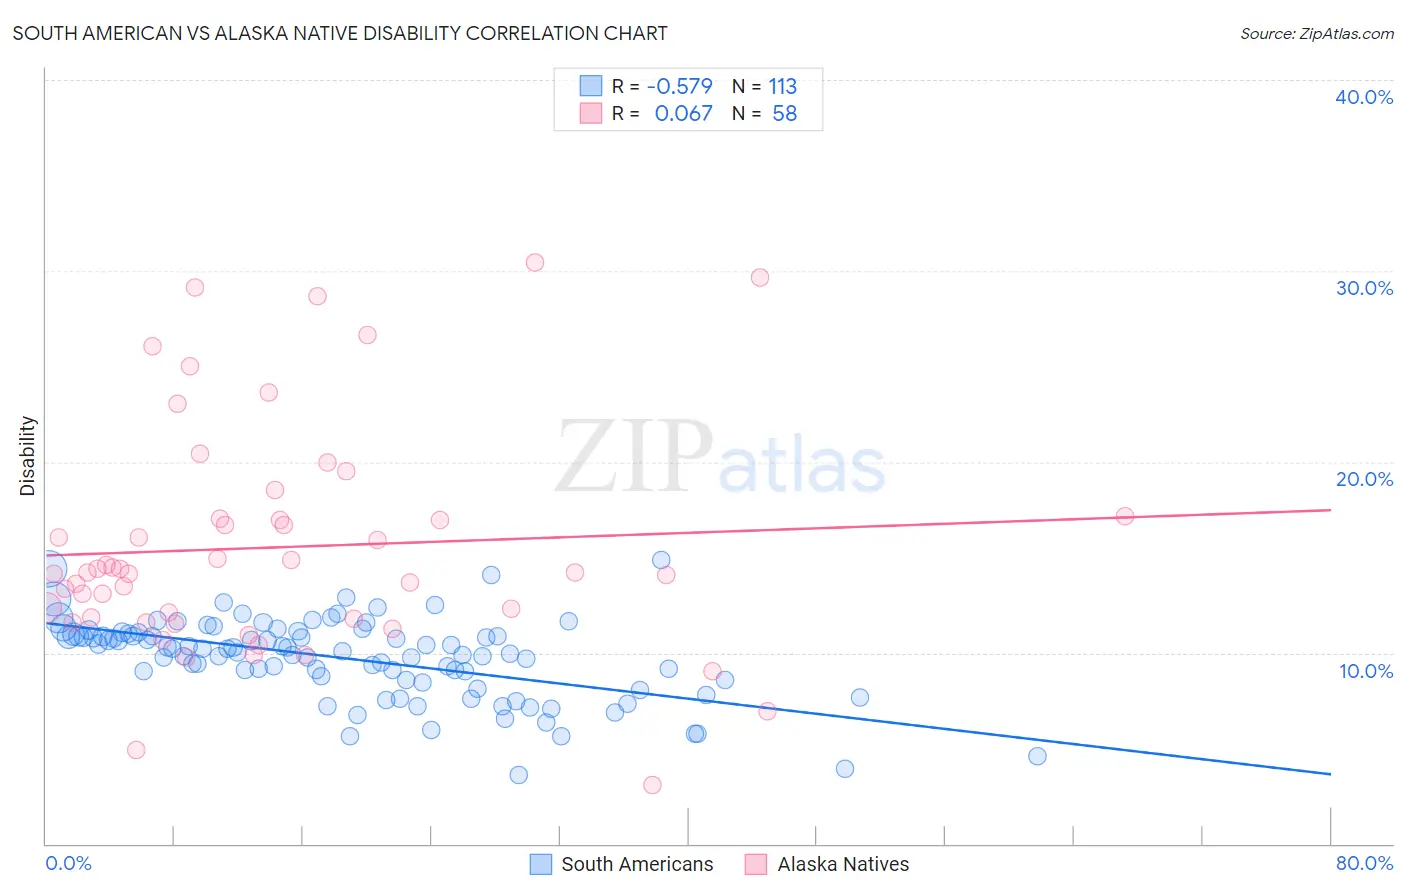
South American vs Alaska Native Disability Correlation Chart
The statistical analysis conducted on geographies consisting of 494,088,856 people shows a substantial negative correlation between the proportion of South Americans and percentage of population with a disability in the United States with a correlation coefficient (R) of -0.579 and weighted average of 10.9%. Similarly, the statistical analysis conducted on geographies consisting of 76,775,228 people shows a slight positive correlation between the proportion of Alaska Natives and percentage of population with a disability in the United States with a correlation coefficient (R) of 0.067 and weighted average of 13.2%, a difference of 21.2%.
Disability Correlation Summary
| Measurement | South American | Alaska Native |
| Minimum | 3.6% | 3.1% |
| Maximum | 14.8% | 30.4% |
| Range | 11.3% | 27.4% |
| Mean | 9.7% | 15.5% |
| Median | 10.2% | 14.2% |
| Interquartile 25% (IQ1) | 8.6% | 11.8% |
| Interquartile 75% (IQ3) | 11.0% | 17.0% |
| Interquartile Range (IQR) | 2.4% | 5.2% |
| Standard Deviation (Sample) | 2.1% | 6.0% |
| Standard Deviation (Population) | 2.1% | 5.9% |
Similar Demographics by Disability
Demographics Similar to South Americans by Disability
In terms of disability, the demographic groups most similar to South Americans are Immigrants from Spain (10.9%, a difference of 0.020%), Jordanian (10.9%, a difference of 0.020%), Peruvian (10.9%, a difference of 0.060%), Vietnamese (10.9%, a difference of 0.070%), and Immigrants from Saudi Arabia (10.9%, a difference of 0.070%).
| Demographics | Rating | Rank | Disability |
| Immigrants | Peru | 99.9 /100 | #45 | Exceptional 10.8% |
| Tongans | 99.9 /100 | #46 | Exceptional 10.8% |
| Taiwanese | 99.9 /100 | #47 | Exceptional 10.8% |
| Soviet Union | 99.9 /100 | #48 | Exceptional 10.9% |
| Vietnamese | 99.9 /100 | #49 | Exceptional 10.9% |
| Immigrants | Saudi Arabia | 99.9 /100 | #50 | Exceptional 10.9% |
| Peruvians | 99.8 /100 | #51 | Exceptional 10.9% |
| South Americans | 99.8 /100 | #52 | Exceptional 10.9% |
| Immigrants | Spain | 99.8 /100 | #53 | Exceptional 10.9% |
| Jordanians | 99.8 /100 | #54 | Exceptional 10.9% |
| Immigrants | El Salvador | 99.8 /100 | #55 | Exceptional 10.9% |
| Immigrants | Lithuania | 99.8 /100 | #56 | Exceptional 10.9% |
| Salvadorans | 99.8 /100 | #57 | Exceptional 10.9% |
| Immigrants | South America | 99.8 /100 | #58 | Exceptional 10.9% |
| Immigrants | Colombia | 99.7 /100 | #59 | Exceptional 10.9% |
Demographics Similar to Alaska Natives by Disability
In terms of disability, the demographic groups most similar to Alaska Natives are Hopi (13.2%, a difference of 0.010%), French (13.2%, a difference of 0.020%), Central American Indian (13.2%, a difference of 0.070%), Pennsylvania German (13.2%, a difference of 0.070%), and Nonimmigrants (13.2%, a difference of 0.11%).
| Demographics | Rating | Rank | Disability |
| Yaqui | 0.0 /100 | #291 | Tragic 13.1% |
| Aleuts | 0.0 /100 | #292 | Tragic 13.1% |
| Marshallese | 0.0 /100 | #293 | Tragic 13.1% |
| Celtics | 0.0 /100 | #294 | Tragic 13.1% |
| Immigrants | Nonimmigrants | 0.0 /100 | #295 | Tragic 13.2% |
| Central American Indians | 0.0 /100 | #296 | Tragic 13.2% |
| Hopi | 0.0 /100 | #297 | Tragic 13.2% |
| Alaska Natives | 0.0 /100 | #298 | Tragic 13.2% |
| French | 0.0 /100 | #299 | Tragic 13.2% |
| Pennsylvania Germans | 0.0 /100 | #300 | Tragic 13.2% |
| Immigrants | Micronesia | 0.0 /100 | #301 | Tragic 13.2% |
| Arapaho | 0.0 /100 | #302 | Tragic 13.2% |
| Scotch-Irish | 0.0 /100 | #303 | Tragic 13.3% |
| Yakama | 0.0 /100 | #304 | Tragic 13.4% |
| French Canadians | 0.0 /100 | #305 | Tragic 13.4% |