Immigrants from Philippines vs Alaska Native In Labor Force | Age > 16
COMPARE
Immigrants from Philippines
Alaska Native
In Labor Force | Age > 16
In Labor Force | Age > 16 Comparison
Immigrants from Philippines
Alaska Natives
65.6%
IN LABOR FORCE | AGE > 16
94.5/ 100
METRIC RATING
129th/ 347
METRIC RANK
64.7%
IN LABOR FORCE | AGE > 16
9.9/ 100
METRIC RATING
220th/ 347
METRIC RANK
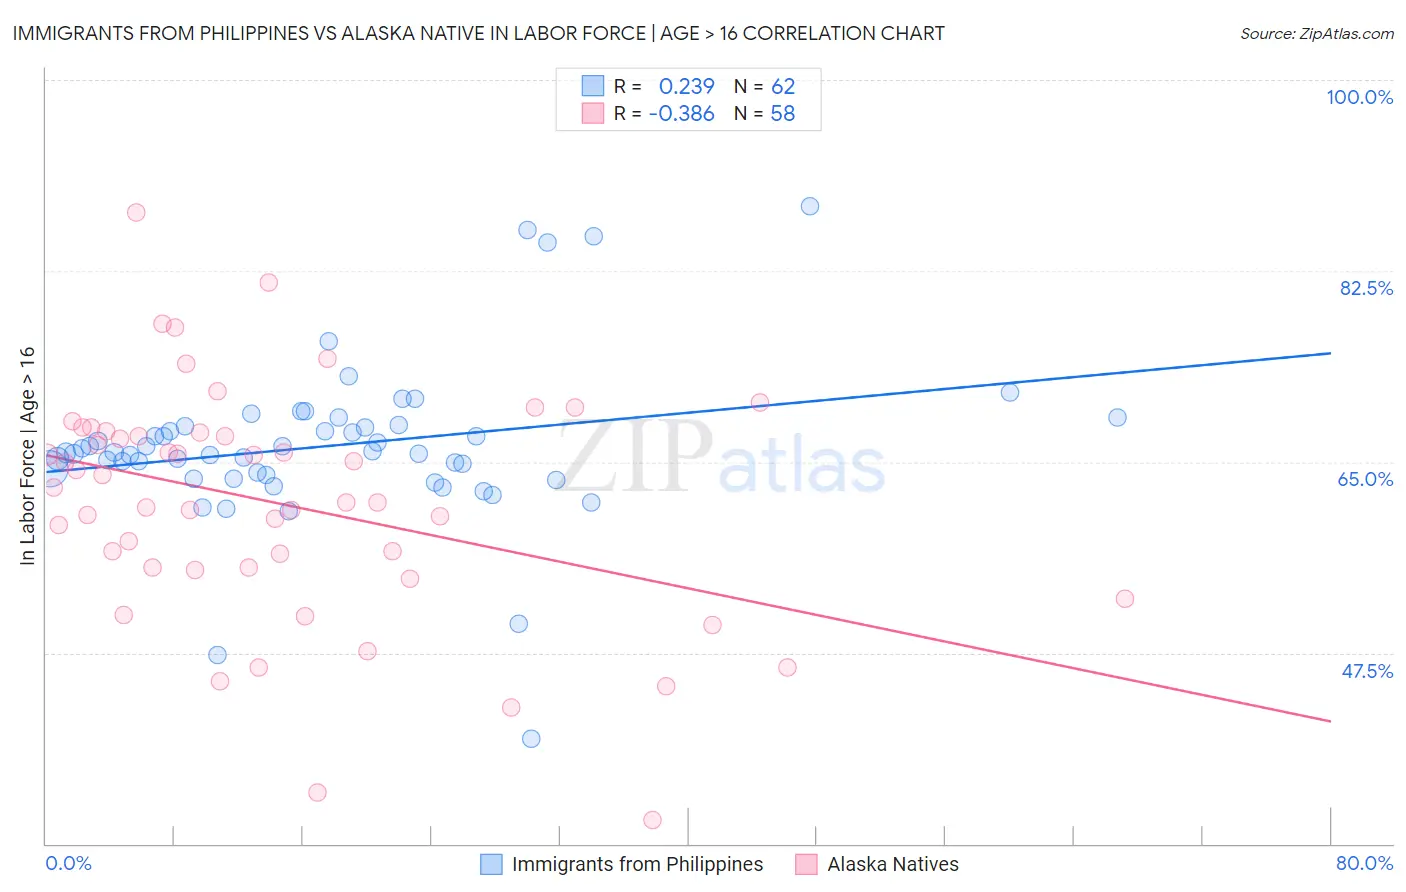
Immigrants from Philippines vs Alaska Native In Labor Force | Age > 16 Correlation Chart
The statistical analysis conducted on geographies consisting of 471,291,976 people shows a weak positive correlation between the proportion of Immigrants from Philippines and labor force participation rate among population ages 16 and over in the United States with a correlation coefficient (R) of 0.239 and weighted average of 65.6%. Similarly, the statistical analysis conducted on geographies consisting of 76,778,571 people shows a mild negative correlation between the proportion of Alaska Natives and labor force participation rate among population ages 16 and over in the United States with a correlation coefficient (R) of -0.386 and weighted average of 64.7%, a difference of 1.4%.
In Labor Force | Age > 16 Correlation Summary
| Measurement | Immigrants from Philippines | Alaska Native |
| Minimum | 39.6% | 32.2% |
| Maximum | 88.4% | 87.9% |
| Range | 48.8% | 55.7% |
| Mean | 66.5% | 61.2% |
| Median | 65.8% | 62.0% |
| Interquartile 25% (IQ1) | 63.8% | 55.3% |
| Interquartile 75% (IQ3) | 68.3% | 67.7% |
| Interquartile Range (IQR) | 4.5% | 12.4% |
| Standard Deviation (Sample) | 7.5% | 10.7% |
| Standard Deviation (Population) | 7.5% | 10.7% |
Similar Demographics by In Labor Force | Age > 16
Demographics Similar to Immigrants from Philippines by In Labor Force | Age > 16
In terms of in labor force | age > 16, the demographic groups most similar to Immigrants from Philippines are Immigrants from Guatemala (65.6%, a difference of 0.0%), Ecuadorian (65.6%, a difference of 0.010%), Icelander (65.6%, a difference of 0.010%), Immigrants from Eastern Asia (65.7%, a difference of 0.020%), and Immigrants from North Macedonia (65.6%, a difference of 0.020%).
| Demographics | Rating | Rank | In Labor Force | Age > 16 |
| Immigrants | Ecuador | 95.9 /100 | #122 | Exceptional 65.7% |
| Immigrants | Iraq | 95.5 /100 | #123 | Exceptional 65.7% |
| Iraqis | 95.4 /100 | #124 | Exceptional 65.7% |
| Norwegians | 95.3 /100 | #125 | Exceptional 65.7% |
| Koreans | 95.3 /100 | #126 | Exceptional 65.7% |
| Immigrants | Eastern Asia | 94.9 /100 | #127 | Exceptional 65.7% |
| Ecuadorians | 94.7 /100 | #128 | Exceptional 65.6% |
| Immigrants | Philippines | 94.5 /100 | #129 | Exceptional 65.6% |
| Immigrants | Guatemala | 94.4 /100 | #130 | Exceptional 65.6% |
| Icelanders | 94.3 /100 | #131 | Exceptional 65.6% |
| Immigrants | North Macedonia | 94.1 /100 | #132 | Exceptional 65.6% |
| Immigrants | Lithuania | 93.5 /100 | #133 | Exceptional 65.6% |
| Costa Ricans | 93.2 /100 | #134 | Exceptional 65.6% |
| Guatemalans | 92.5 /100 | #135 | Exceptional 65.6% |
| Immigrants | Argentina | 92.4 /100 | #136 | Exceptional 65.6% |
Demographics Similar to Alaska Natives by In Labor Force | Age > 16
In terms of in labor force | age > 16, the demographic groups most similar to Alaska Natives are Immigrants from Micronesia (64.7%, a difference of 0.010%), Immigrants from Central America (64.7%, a difference of 0.020%), Hawaiian (64.7%, a difference of 0.020%), Immigrants from Belize (64.7%, a difference of 0.020%), and Alsatian (64.7%, a difference of 0.030%).
| Demographics | Rating | Rank | In Labor Force | Age > 16 |
| Maltese | 13.8 /100 | #213 | Poor 64.8% |
| Estonians | 13.1 /100 | #214 | Poor 64.8% |
| Immigrants | Czechoslovakia | 12.3 /100 | #215 | Poor 64.8% |
| Belgians | 11.4 /100 | #216 | Poor 64.7% |
| U.S. Virgin Islanders | 11.3 /100 | #217 | Poor 64.7% |
| Alsatians | 10.7 /100 | #218 | Poor 64.7% |
| Immigrants | Central America | 10.5 /100 | #219 | Poor 64.7% |
| Alaska Natives | 9.9 /100 | #220 | Tragic 64.7% |
| Immigrants | Micronesia | 9.6 /100 | #221 | Tragic 64.7% |
| Hawaiians | 9.3 /100 | #222 | Tragic 64.7% |
| Immigrants | Belize | 9.2 /100 | #223 | Tragic 64.7% |
| Immigrants | Jamaica | 8.8 /100 | #224 | Tragic 64.7% |
| Croatians | 8.8 /100 | #225 | Tragic 64.7% |
| Europeans | 8.3 /100 | #226 | Tragic 64.7% |
| Poles | 8.3 /100 | #227 | Tragic 64.7% |