Immigrants from Sudan vs Alaska Native Disability
COMPARE
Immigrants from Sudan
Alaska Native
Disability
Disability Comparison
Immigrants from Sudan
Alaska Natives
11.5%
DISABILITY
85.3/ 100
METRIC RATING
142nd/ 347
METRIC RANK
13.2%
DISABILITY
0.0/ 100
METRIC RATING
298th/ 347
METRIC RANK
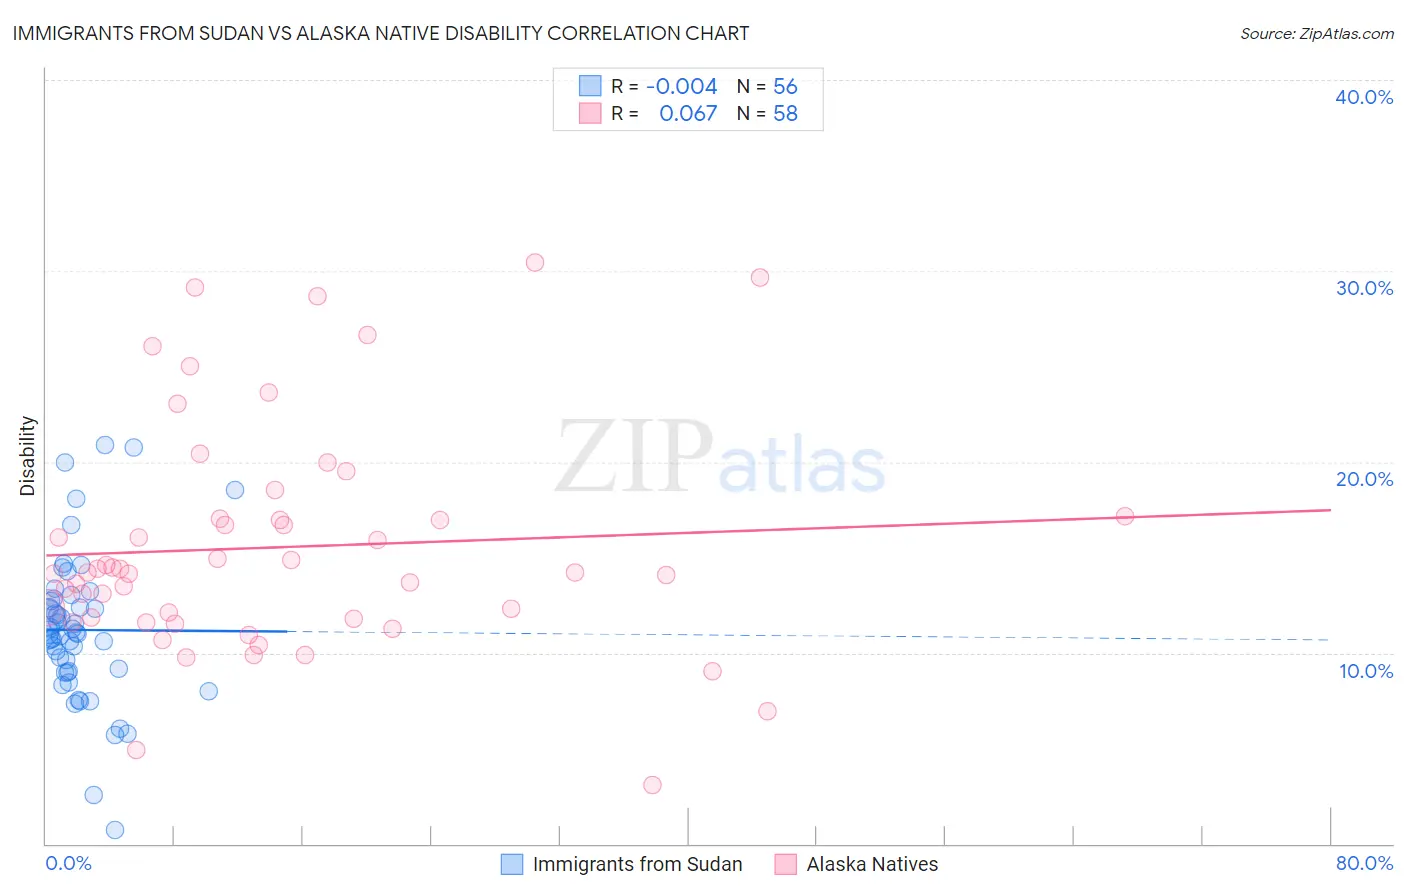
Immigrants from Sudan vs Alaska Native Disability Correlation Chart
The statistical analysis conducted on geographies consisting of 118,962,854 people shows no correlation between the proportion of Immigrants from Sudan and percentage of population with a disability in the United States with a correlation coefficient (R) of -0.004 and weighted average of 11.5%. Similarly, the statistical analysis conducted on geographies consisting of 76,775,228 people shows a slight positive correlation between the proportion of Alaska Natives and percentage of population with a disability in the United States with a correlation coefficient (R) of 0.067 and weighted average of 13.2%, a difference of 14.8%.
Disability Correlation Summary
| Measurement | Immigrants from Sudan | Alaska Native |
| Minimum | 0.75% | 3.1% |
| Maximum | 20.9% | 30.4% |
| Range | 20.1% | 27.4% |
| Mean | 11.2% | 15.5% |
| Median | 11.0% | 14.2% |
| Interquartile 25% (IQ1) | 9.0% | 11.8% |
| Interquartile 75% (IQ3) | 12.8% | 17.0% |
| Interquartile Range (IQR) | 3.8% | 5.2% |
| Standard Deviation (Sample) | 3.9% | 6.0% |
| Standard Deviation (Population) | 3.9% | 5.9% |
Similar Demographics by Disability
Demographics Similar to Immigrants from Sudan by Disability
In terms of disability, the demographic groups most similar to Immigrants from Sudan are Immigrants from Grenada (11.5%, a difference of 0.070%), Russian (11.5%, a difference of 0.14%), New Zealander (11.5%, a difference of 0.16%), Ghanaian (11.5%, a difference of 0.16%), and Kenyan (11.5%, a difference of 0.17%).
| Demographics | Rating | Rank | Disability |
| Ugandans | 87.9 /100 | #135 | Excellent 11.4% |
| Immigrants | St. Vincent and the Grenadines | 87.8 /100 | #136 | Excellent 11.4% |
| Kenyans | 87.1 /100 | #137 | Excellent 11.5% |
| New Zealanders | 87.0 /100 | #138 | Excellent 11.5% |
| Ghanaians | 87.0 /100 | #139 | Excellent 11.5% |
| Russians | 86.8 /100 | #140 | Excellent 11.5% |
| Immigrants | Grenada | 86.1 /100 | #141 | Excellent 11.5% |
| Immigrants | Sudan | 85.3 /100 | #142 | Excellent 11.5% |
| Moroccans | 83.3 /100 | #143 | Excellent 11.5% |
| Australians | 82.5 /100 | #144 | Excellent 11.5% |
| Nigerians | 81.3 /100 | #145 | Excellent 11.5% |
| Immigrants | Hungary | 79.0 /100 | #146 | Good 11.5% |
| Immigrants | Ukraine | 77.6 /100 | #147 | Good 11.5% |
| Sudanese | 77.1 /100 | #148 | Good 11.5% |
| Immigrants | Norway | 73.2 /100 | #149 | Good 11.6% |
Demographics Similar to Alaska Natives by Disability
In terms of disability, the demographic groups most similar to Alaska Natives are Hopi (13.2%, a difference of 0.010%), French (13.2%, a difference of 0.020%), Central American Indian (13.2%, a difference of 0.070%), Pennsylvania German (13.2%, a difference of 0.070%), and Nonimmigrants (13.2%, a difference of 0.11%).
| Demographics | Rating | Rank | Disability |
| Yaqui | 0.0 /100 | #291 | Tragic 13.1% |
| Aleuts | 0.0 /100 | #292 | Tragic 13.1% |
| Marshallese | 0.0 /100 | #293 | Tragic 13.1% |
| Celtics | 0.0 /100 | #294 | Tragic 13.1% |
| Immigrants | Nonimmigrants | 0.0 /100 | #295 | Tragic 13.2% |
| Central American Indians | 0.0 /100 | #296 | Tragic 13.2% |
| Hopi | 0.0 /100 | #297 | Tragic 13.2% |
| Alaska Natives | 0.0 /100 | #298 | Tragic 13.2% |
| French | 0.0 /100 | #299 | Tragic 13.2% |
| Pennsylvania Germans | 0.0 /100 | #300 | Tragic 13.2% |
| Immigrants | Micronesia | 0.0 /100 | #301 | Tragic 13.2% |
| Arapaho | 0.0 /100 | #302 | Tragic 13.2% |
| Scotch-Irish | 0.0 /100 | #303 | Tragic 13.3% |
| Yakama | 0.0 /100 | #304 | Tragic 13.4% |
| French Canadians | 0.0 /100 | #305 | Tragic 13.4% |