Trinidadian and Tobagonian vs Immigrants from Grenada Vision Disability
COMPARE
Trinidadian and Tobagonian
Immigrants from Grenada
Vision Disability
Vision Disability Comparison
Trinidadians and Tobagonians
Immigrants from Grenada
2.2%
VISION DISABILITY
8.2/ 100
METRIC RATING
214th/ 347
METRIC RANK
2.2%
VISION DISABILITY
23.1/ 100
METRIC RATING
196th/ 347
METRIC RANK
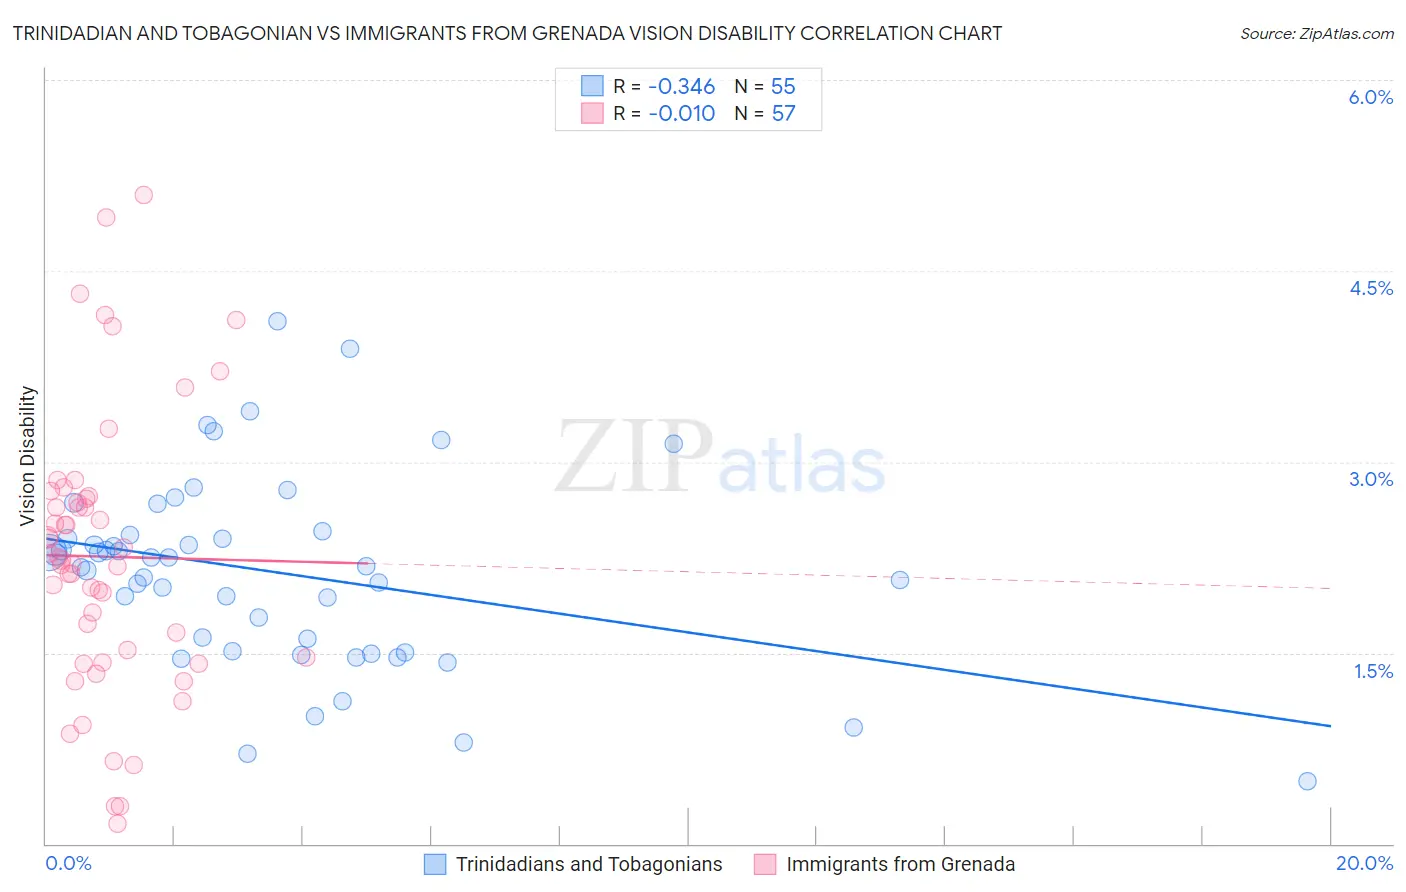
Trinidadian and Tobagonian vs Immigrants from Grenada Vision Disability Correlation Chart
The statistical analysis conducted on geographies consisting of 219,745,653 people shows a mild negative correlation between the proportion of Trinidadians and Tobagonians and percentage of population with vision disability in the United States with a correlation coefficient (R) of -0.346 and weighted average of 2.2%. Similarly, the statistical analysis conducted on geographies consisting of 67,180,438 people shows no correlation between the proportion of Immigrants from Grenada and percentage of population with vision disability in the United States with a correlation coefficient (R) of -0.010 and weighted average of 2.2%, a difference of 1.9%.
Vision Disability Correlation Summary
| Measurement | Trinidadian and Tobagonian | Immigrants from Grenada |
| Minimum | 0.49% | 0.16% |
| Maximum | 4.1% | 5.1% |
| Range | 3.6% | 4.9% |
| Mean | 2.1% | 2.3% |
| Median | 2.2% | 2.2% |
| Interquartile 25% (IQ1) | 1.5% | 1.4% |
| Interquartile 75% (IQ3) | 2.4% | 2.7% |
| Interquartile Range (IQR) | 0.92% | 1.3% |
| Standard Deviation (Sample) | 0.75% | 1.1% |
| Standard Deviation (Population) | 0.74% | 1.1% |
Demographics Similar to Trinidadians and Tobagonians and Immigrants from Grenada by Vision Disability
In terms of vision disability, the demographic groups most similar to Trinidadians and Tobagonians are Immigrants from Ghana (2.2%, a difference of 0.13%), Bermudan (2.2%, a difference of 0.14%), Nigerian (2.3%, a difference of 0.21%), Indonesian (2.2%, a difference of 0.23%), and Immigrants from Uruguay (2.2%, a difference of 0.57%). Similarly, the demographic groups most similar to Immigrants from Grenada are Immigrants (2.2%, a difference of 0.050%), Ghanaian (2.2%, a difference of 0.11%), Czechoslovakian (2.2%, a difference of 0.13%), Immigrants from El Salvador (2.2%, a difference of 0.18%), and Immigrants from Thailand (2.2%, a difference of 0.27%).
| Demographics | Rating | Rank | Vision Disability |
| Immigrants | Immigrants | 23.7 /100 | #195 | Fair 2.2% |
| Immigrants | Grenada | 23.1 /100 | #196 | Fair 2.2% |
| Ghanaians | 21.8 /100 | #197 | Fair 2.2% |
| Czechoslovakians | 21.6 /100 | #198 | Fair 2.2% |
| Immigrants | El Salvador | 21.0 /100 | #199 | Fair 2.2% |
| Immigrants | Thailand | 20.1 /100 | #200 | Fair 2.2% |
| Slovaks | 18.8 /100 | #201 | Poor 2.2% |
| Immigrants | Zaire | 18.0 /100 | #202 | Poor 2.2% |
| Dutch | 17.1 /100 | #203 | Poor 2.2% |
| Immigrants | Guyana | 15.9 /100 | #204 | Poor 2.2% |
| Samoans | 15.7 /100 | #205 | Poor 2.2% |
| Pennsylvania Germans | 14.5 /100 | #206 | Poor 2.2% |
| Immigrants | Nigeria | 13.5 /100 | #207 | Poor 2.2% |
| Germans | 13.4 /100 | #208 | Poor 2.2% |
| Immigrants | Brazil | 13.1 /100 | #209 | Poor 2.2% |
| Immigrants | Uruguay | 11.5 /100 | #210 | Poor 2.2% |
| Indonesians | 9.5 /100 | #211 | Tragic 2.2% |
| Bermudans | 9.0 /100 | #212 | Tragic 2.2% |
| Immigrants | Ghana | 8.9 /100 | #213 | Tragic 2.2% |
| Trinidadians and Tobagonians | 8.2 /100 | #214 | Tragic 2.2% |
| Nigerians | 7.2 /100 | #215 | Tragic 2.3% |