Thai vs Immigrants from Grenada Vision Disability
COMPARE
Thai
Immigrants from Grenada
Vision Disability
Vision Disability Comparison
Thais
Immigrants from Grenada
1.7%
VISION DISABILITY
100.0/ 100
METRIC RATING
4th/ 347
METRIC RANK
2.2%
VISION DISABILITY
23.1/ 100
METRIC RATING
196th/ 347
METRIC RANK
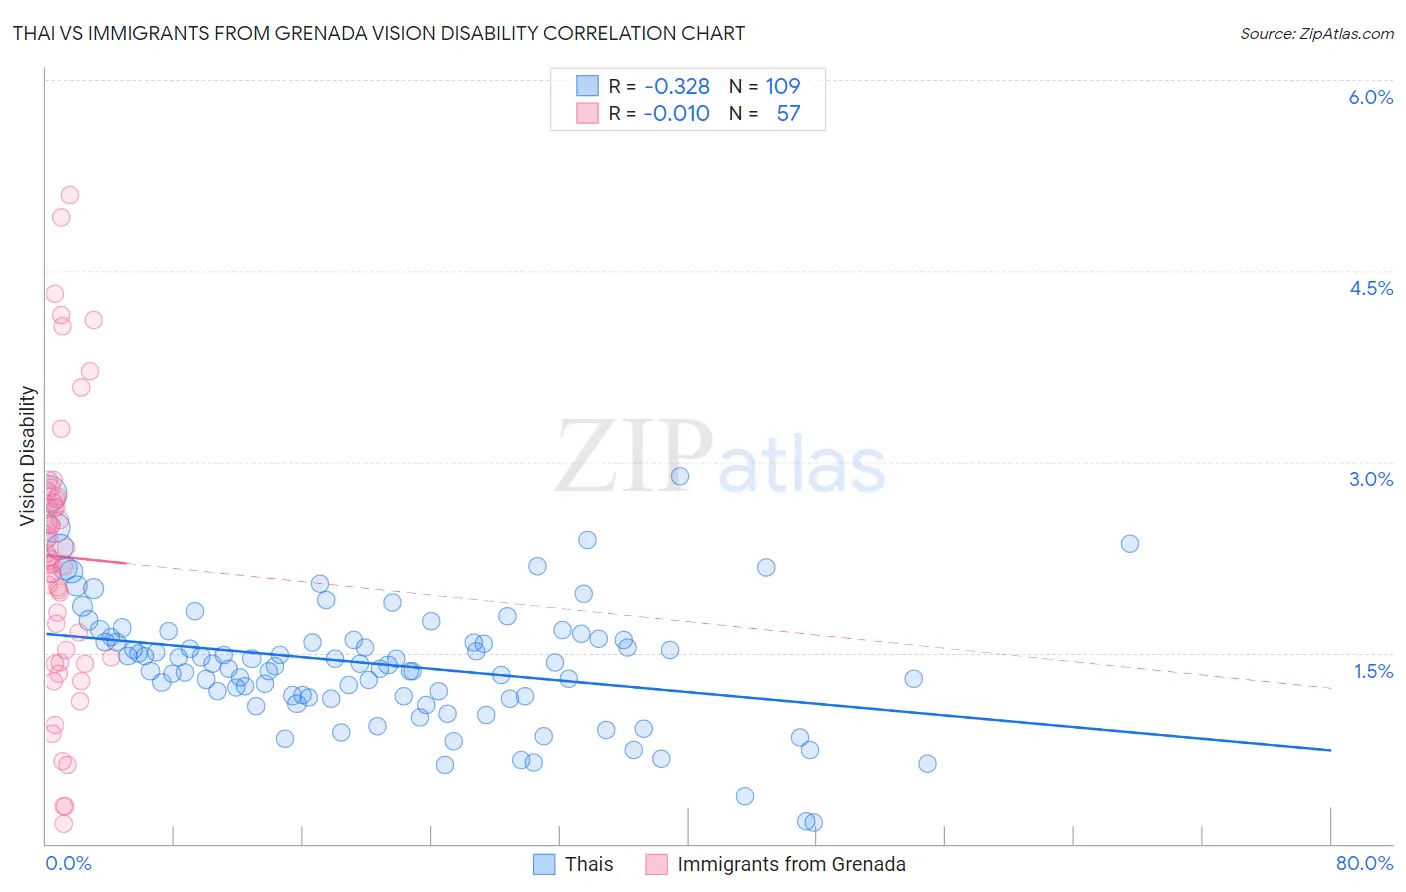
Thai vs Immigrants from Grenada Vision Disability Correlation Chart
The statistical analysis conducted on geographies consisting of 475,304,455 people shows a mild negative correlation between the proportion of Thais and percentage of population with vision disability in the United States with a correlation coefficient (R) of -0.328 and weighted average of 1.7%. Similarly, the statistical analysis conducted on geographies consisting of 67,180,438 people shows no correlation between the proportion of Immigrants from Grenada and percentage of population with vision disability in the United States with a correlation coefficient (R) of -0.010 and weighted average of 2.2%, a difference of 26.8%.
Vision Disability Correlation Summary
| Measurement | Thai | Immigrants from Grenada |
| Minimum | 0.17% | 0.16% |
| Maximum | 2.9% | 5.1% |
| Range | 2.7% | 4.9% |
| Mean | 1.4% | 2.3% |
| Median | 1.4% | 2.2% |
| Interquartile 25% (IQ1) | 1.2% | 1.4% |
| Interquartile 75% (IQ3) | 1.6% | 2.7% |
| Interquartile Range (IQR) | 0.47% | 1.3% |
| Standard Deviation (Sample) | 0.49% | 1.1% |
| Standard Deviation (Population) | 0.48% | 1.1% |
Similar Demographics by Vision Disability
Demographics Similar to Thais by Vision Disability
In terms of vision disability, the demographic groups most similar to Thais are Okinawan (1.8%, a difference of 1.9%), Immigrants from Iran (1.8%, a difference of 2.5%), Immigrants from South Central Asia (1.8%, a difference of 2.6%), Immigrants from Taiwan (1.7%, a difference of 2.6%), and Iranian (1.8%, a difference of 2.7%).
| Demographics | Rating | Rank | Vision Disability |
| Immigrants | India | 100.0 /100 | #1 | Exceptional 1.7% |
| Filipinos | 100.0 /100 | #2 | Exceptional 1.7% |
| Immigrants | Taiwan | 100.0 /100 | #3 | Exceptional 1.7% |
| Thais | 100.0 /100 | #4 | Exceptional 1.7% |
| Okinawans | 100.0 /100 | #5 | Exceptional 1.8% |
| Immigrants | Iran | 100.0 /100 | #6 | Exceptional 1.8% |
| Immigrants | South Central Asia | 100.0 /100 | #7 | Exceptional 1.8% |
| Iranians | 100.0 /100 | #8 | Exceptional 1.8% |
| Immigrants | Singapore | 100.0 /100 | #9 | Exceptional 1.8% |
| Immigrants | Hong Kong | 100.0 /100 | #10 | Exceptional 1.8% |
| Immigrants | Israel | 100.0 /100 | #11 | Exceptional 1.8% |
| Immigrants | Korea | 100.0 /100 | #12 | Exceptional 1.8% |
| Immigrants | Eastern Asia | 100.0 /100 | #13 | Exceptional 1.8% |
| Immigrants | China | 100.0 /100 | #14 | Exceptional 1.8% |
| Immigrants | Bolivia | 100.0 /100 | #15 | Exceptional 1.8% |
Demographics Similar to Immigrants from Grenada by Vision Disability
In terms of vision disability, the demographic groups most similar to Immigrants from Grenada are Immigrants (2.2%, a difference of 0.050%), Immigrants from Barbados (2.2%, a difference of 0.070%), Ghanaian (2.2%, a difference of 0.11%), Czechoslovakian (2.2%, a difference of 0.13%), and British (2.2%, a difference of 0.17%).
| Demographics | Rating | Rank | Vision Disability |
| Salvadorans | 27.4 /100 | #189 | Fair 2.2% |
| Immigrants | Costa Rica | 26.1 /100 | #190 | Fair 2.2% |
| Canadians | 25.8 /100 | #191 | Fair 2.2% |
| Europeans | 25.7 /100 | #192 | Fair 2.2% |
| British | 25.1 /100 | #193 | Fair 2.2% |
| Immigrants | Barbados | 24.0 /100 | #194 | Fair 2.2% |
| Immigrants | Immigrants | 23.7 /100 | #195 | Fair 2.2% |
| Immigrants | Grenada | 23.1 /100 | #196 | Fair 2.2% |
| Ghanaians | 21.8 /100 | #197 | Fair 2.2% |
| Czechoslovakians | 21.6 /100 | #198 | Fair 2.2% |
| Immigrants | El Salvador | 21.0 /100 | #199 | Fair 2.2% |
| Immigrants | Thailand | 20.1 /100 | #200 | Fair 2.2% |
| Slovaks | 18.8 /100 | #201 | Poor 2.2% |
| Immigrants | Zaire | 18.0 /100 | #202 | Poor 2.2% |
| Dutch | 17.1 /100 | #203 | Poor 2.2% |