Immigrants from Oceania vs Chinese Ambulatory Disability
COMPARE
Immigrants from Oceania
Chinese
Ambulatory Disability
Ambulatory Disability Comparison
Immigrants from Oceania
Chinese
6.1%
AMBULATORY DISABILITY
60.7/ 100
METRIC RATING
167th/ 347
METRIC RANK
6.5%
AMBULATORY DISABILITY
1.0/ 100
METRIC RATING
250th/ 347
METRIC RANK
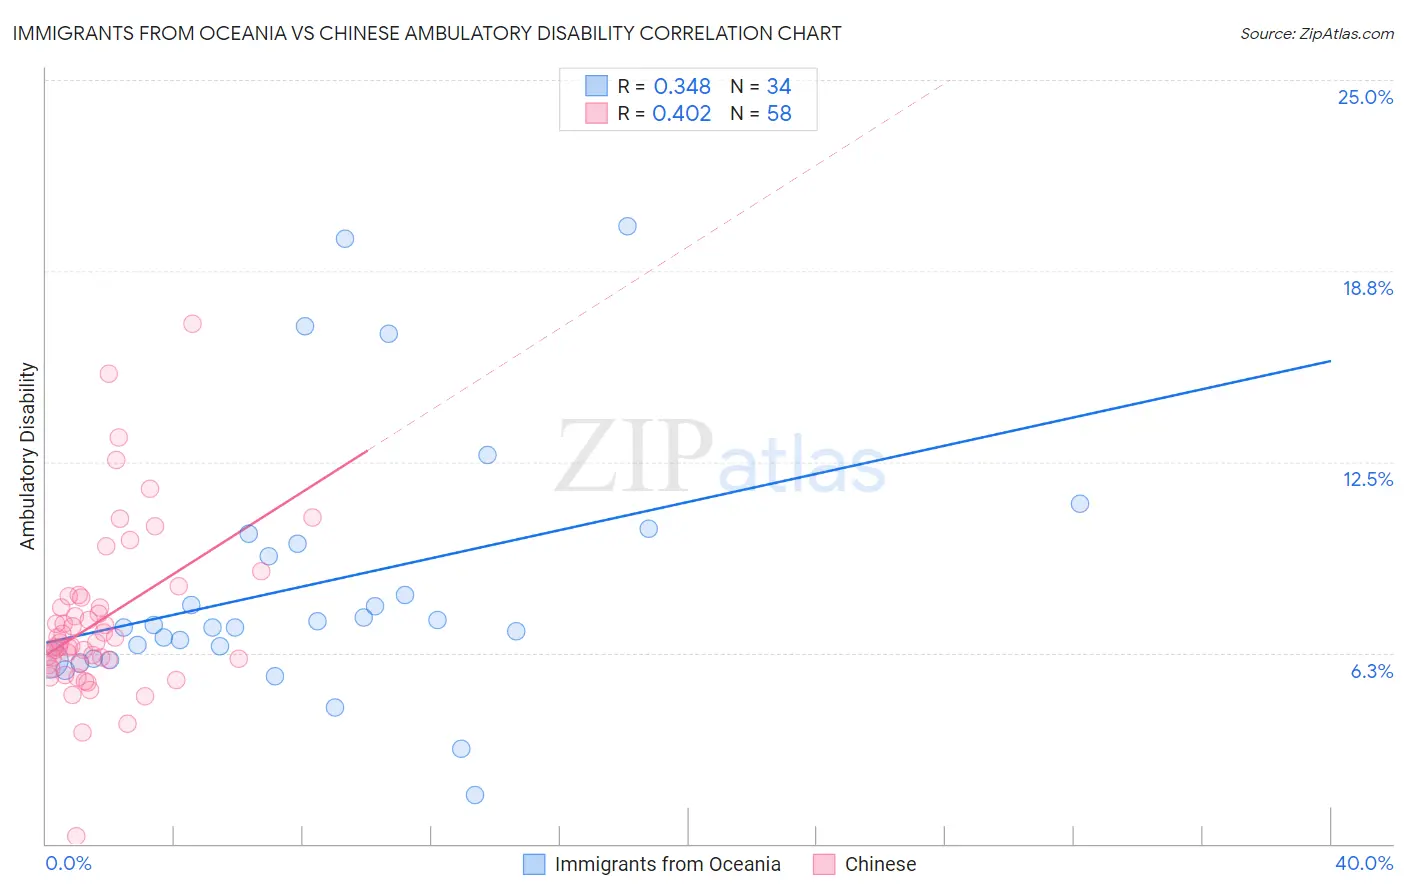
Immigrants from Oceania vs Chinese Ambulatory Disability Correlation Chart
The statistical analysis conducted on geographies consisting of 305,408,228 people shows a mild positive correlation between the proportion of Immigrants from Oceania and percentage of population with ambulatory disability in the United States with a correlation coefficient (R) of 0.348 and weighted average of 6.1%. Similarly, the statistical analysis conducted on geographies consisting of 64,795,509 people shows a moderate positive correlation between the proportion of Chinese and percentage of population with ambulatory disability in the United States with a correlation coefficient (R) of 0.402 and weighted average of 6.5%, a difference of 6.6%.
Ambulatory Disability Correlation Summary
| Measurement | Immigrants from Oceania | Chinese |
| Minimum | 1.6% | 0.26% |
| Maximum | 20.2% | 17.0% |
| Range | 18.6% | 16.8% |
| Mean | 8.5% | 7.3% |
| Median | 7.1% | 6.6% |
| Interquartile 25% (IQ1) | 6.1% | 5.9% |
| Interquartile 75% (IQ3) | 9.8% | 8.1% |
| Interquartile Range (IQR) | 3.8% | 2.2% |
| Standard Deviation (Sample) | 4.3% | 2.7% |
| Standard Deviation (Population) | 4.2% | 2.7% |
Similar Demographics by Ambulatory Disability
Demographics Similar to Immigrants from Oceania by Ambulatory Disability
In terms of ambulatory disability, the demographic groups most similar to Immigrants from Oceania are Ecuadorian (6.1%, a difference of 0.010%), Iraqi (6.1%, a difference of 0.12%), Nicaraguan (6.1%, a difference of 0.14%), Immigrants from Southern Europe (6.1%, a difference of 0.15%), and Basque (6.1%, a difference of 0.17%).
| Demographics | Rating | Rank | Ambulatory Disability |
| Central Americans | 69.8 /100 | #160 | Good 6.0% |
| Immigrants | Belarus | 69.2 /100 | #161 | Good 6.1% |
| Nigerians | 67.1 /100 | #162 | Good 6.1% |
| Lebanese | 66.2 /100 | #163 | Good 6.1% |
| Basques | 63.7 /100 | #164 | Good 6.1% |
| Nicaraguans | 63.2 /100 | #165 | Good 6.1% |
| Iraqis | 62.8 /100 | #166 | Good 6.1% |
| Immigrants | Oceania | 60.7 /100 | #167 | Good 6.1% |
| Ecuadorians | 60.5 /100 | #168 | Good 6.1% |
| Immigrants | Southern Europe | 58.1 /100 | #169 | Average 6.1% |
| Immigrants | Ecuador | 53.8 /100 | #170 | Average 6.1% |
| Moroccans | 52.6 /100 | #171 | Average 6.1% |
| Immigrants | Burma/Myanmar | 52.2 /100 | #172 | Average 6.1% |
| Croatians | 51.2 /100 | #173 | Average 6.1% |
| Immigrants | Canada | 50.0 /100 | #174 | Average 6.1% |
Demographics Similar to Chinese by Ambulatory Disability
In terms of ambulatory disability, the demographic groups most similar to Chinese are Native Hawaiian (6.5%, a difference of 0.080%), Hawaiian (6.5%, a difference of 0.18%), Immigrants from Portugal (6.5%, a difference of 0.36%), Immigrants from Cuba (6.5%, a difference of 0.38%), and Immigrants from Bahamas (6.5%, a difference of 0.38%).
| Demographics | Rating | Rank | Ambulatory Disability |
| Germans | 1.5 /100 | #243 | Tragic 6.5% |
| Immigrants | Panama | 1.5 /100 | #244 | Tragic 6.5% |
| Tlingit-Haida | 1.5 /100 | #245 | Tragic 6.5% |
| Armenians | 1.5 /100 | #246 | Tragic 6.5% |
| Immigrants | Cuba | 1.4 /100 | #247 | Tragic 6.5% |
| Immigrants | Portugal | 1.4 /100 | #248 | Tragic 6.5% |
| Native Hawaiians | 1.1 /100 | #249 | Tragic 6.5% |
| Chinese | 1.0 /100 | #250 | Tragic 6.5% |
| Hawaiians | 0.9 /100 | #251 | Tragic 6.5% |
| Immigrants | Bahamas | 0.8 /100 | #252 | Tragic 6.5% |
| Scottish | 0.7 /100 | #253 | Tragic 6.5% |
| Belizeans | 0.7 /100 | #254 | Tragic 6.5% |
| Welsh | 0.6 /100 | #255 | Tragic 6.5% |
| Immigrants | Uzbekistan | 0.6 /100 | #256 | Tragic 6.5% |
| Bermudans | 0.5 /100 | #257 | Tragic 6.5% |