Immigrants from Caribbean vs Chinese Ambulatory Disability
COMPARE
Immigrants from Caribbean
Chinese
Ambulatory Disability
Ambulatory Disability Comparison
Immigrants from Caribbean
Chinese
6.7%
AMBULATORY DISABILITY
0.0/ 100
METRIC RATING
279th/ 347
METRIC RANK
6.5%
AMBULATORY DISABILITY
1.0/ 100
METRIC RATING
250th/ 347
METRIC RANK
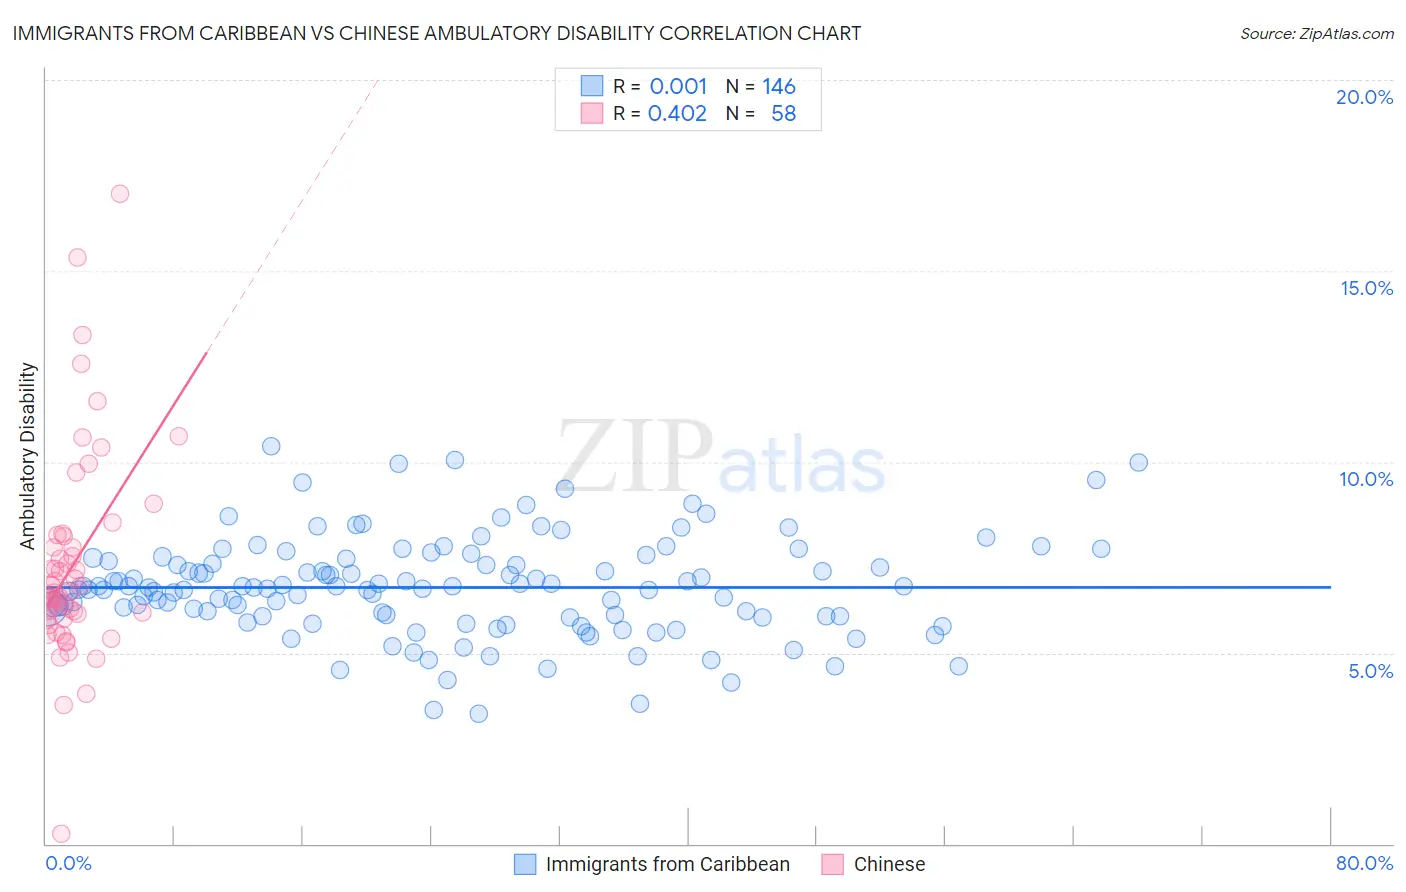
Immigrants from Caribbean vs Chinese Ambulatory Disability Correlation Chart
The statistical analysis conducted on geographies consisting of 449,814,526 people shows no correlation between the proportion of Immigrants from Caribbean and percentage of population with ambulatory disability in the United States with a correlation coefficient (R) of 0.001 and weighted average of 6.7%. Similarly, the statistical analysis conducted on geographies consisting of 64,795,509 people shows a moderate positive correlation between the proportion of Chinese and percentage of population with ambulatory disability in the United States with a correlation coefficient (R) of 0.402 and weighted average of 6.5%, a difference of 4.0%.
Ambulatory Disability Correlation Summary
| Measurement | Immigrants from Caribbean | Chinese |
| Minimum | 3.4% | 0.26% |
| Maximum | 10.4% | 17.0% |
| Range | 7.0% | 16.8% |
| Mean | 6.7% | 7.3% |
| Median | 6.7% | 6.6% |
| Interquartile 25% (IQ1) | 6.0% | 5.9% |
| Interquartile 75% (IQ3) | 7.4% | 8.1% |
| Interquartile Range (IQR) | 1.4% | 2.2% |
| Standard Deviation (Sample) | 1.3% | 2.7% |
| Standard Deviation (Population) | 1.3% | 2.7% |
Similar Demographics by Ambulatory Disability
Demographics Similar to Immigrants from Caribbean by Ambulatory Disability
In terms of ambulatory disability, the demographic groups most similar to Immigrants from Caribbean are Pennsylvania German (6.8%, a difference of 0.10%), Yaqui (6.8%, a difference of 0.17%), Barbadian (6.8%, a difference of 0.30%), Immigrants from West Indies (6.7%, a difference of 0.31%), and Jamaican (6.7%, a difference of 0.39%).
| Demographics | Rating | Rank | Ambulatory Disability |
| French Canadians | 0.1 /100 | #272 | Tragic 6.7% |
| Whites/Caucasians | 0.1 /100 | #273 | Tragic 6.7% |
| Sioux | 0.1 /100 | #274 | Tragic 6.7% |
| Immigrants | Guyana | 0.1 /100 | #275 | Tragic 6.7% |
| Celtics | 0.1 /100 | #276 | Tragic 6.7% |
| Jamaicans | 0.1 /100 | #277 | Tragic 6.7% |
| Immigrants | West Indies | 0.1 /100 | #278 | Tragic 6.7% |
| Immigrants | Caribbean | 0.0 /100 | #279 | Tragic 6.7% |
| Pennsylvania Germans | 0.0 /100 | #280 | Tragic 6.8% |
| Yaqui | 0.0 /100 | #281 | Tragic 6.8% |
| Barbadians | 0.0 /100 | #282 | Tragic 6.8% |
| Immigrants | Barbados | 0.0 /100 | #283 | Tragic 6.8% |
| Immigrants | Jamaica | 0.0 /100 | #284 | Tragic 6.8% |
| Fijians | 0.0 /100 | #285 | Tragic 6.8% |
| Yakama | 0.0 /100 | #286 | Tragic 6.8% |
Demographics Similar to Chinese by Ambulatory Disability
In terms of ambulatory disability, the demographic groups most similar to Chinese are Native Hawaiian (6.5%, a difference of 0.080%), Hawaiian (6.5%, a difference of 0.18%), Immigrants from Portugal (6.5%, a difference of 0.36%), Immigrants from Cuba (6.5%, a difference of 0.38%), and Immigrants from Bahamas (6.5%, a difference of 0.38%).
| Demographics | Rating | Rank | Ambulatory Disability |
| Germans | 1.5 /100 | #243 | Tragic 6.5% |
| Immigrants | Panama | 1.5 /100 | #244 | Tragic 6.5% |
| Tlingit-Haida | 1.5 /100 | #245 | Tragic 6.5% |
| Armenians | 1.5 /100 | #246 | Tragic 6.5% |
| Immigrants | Cuba | 1.4 /100 | #247 | Tragic 6.5% |
| Immigrants | Portugal | 1.4 /100 | #248 | Tragic 6.5% |
| Native Hawaiians | 1.1 /100 | #249 | Tragic 6.5% |
| Chinese | 1.0 /100 | #250 | Tragic 6.5% |
| Hawaiians | 0.9 /100 | #251 | Tragic 6.5% |
| Immigrants | Bahamas | 0.8 /100 | #252 | Tragic 6.5% |
| Scottish | 0.7 /100 | #253 | Tragic 6.5% |
| Belizeans | 0.7 /100 | #254 | Tragic 6.5% |
| Welsh | 0.6 /100 | #255 | Tragic 6.5% |
| Immigrants | Uzbekistan | 0.6 /100 | #256 | Tragic 6.5% |
| Bermudans | 0.5 /100 | #257 | Tragic 6.5% |