Immigrants from Norway vs Subsaharan African Male Disability
COMPARE
Immigrants from Norway
Subsaharan African
Male Disability
Male Disability Comparison
Immigrants from Norway
Sub-Saharan Africans
11.3%
MALE DISABILITY
44.2/ 100
METRIC RATING
177th/ 347
METRIC RANK
11.8%
MALE DISABILITY
2.8/ 100
METRIC RATING
226th/ 347
METRIC RANK
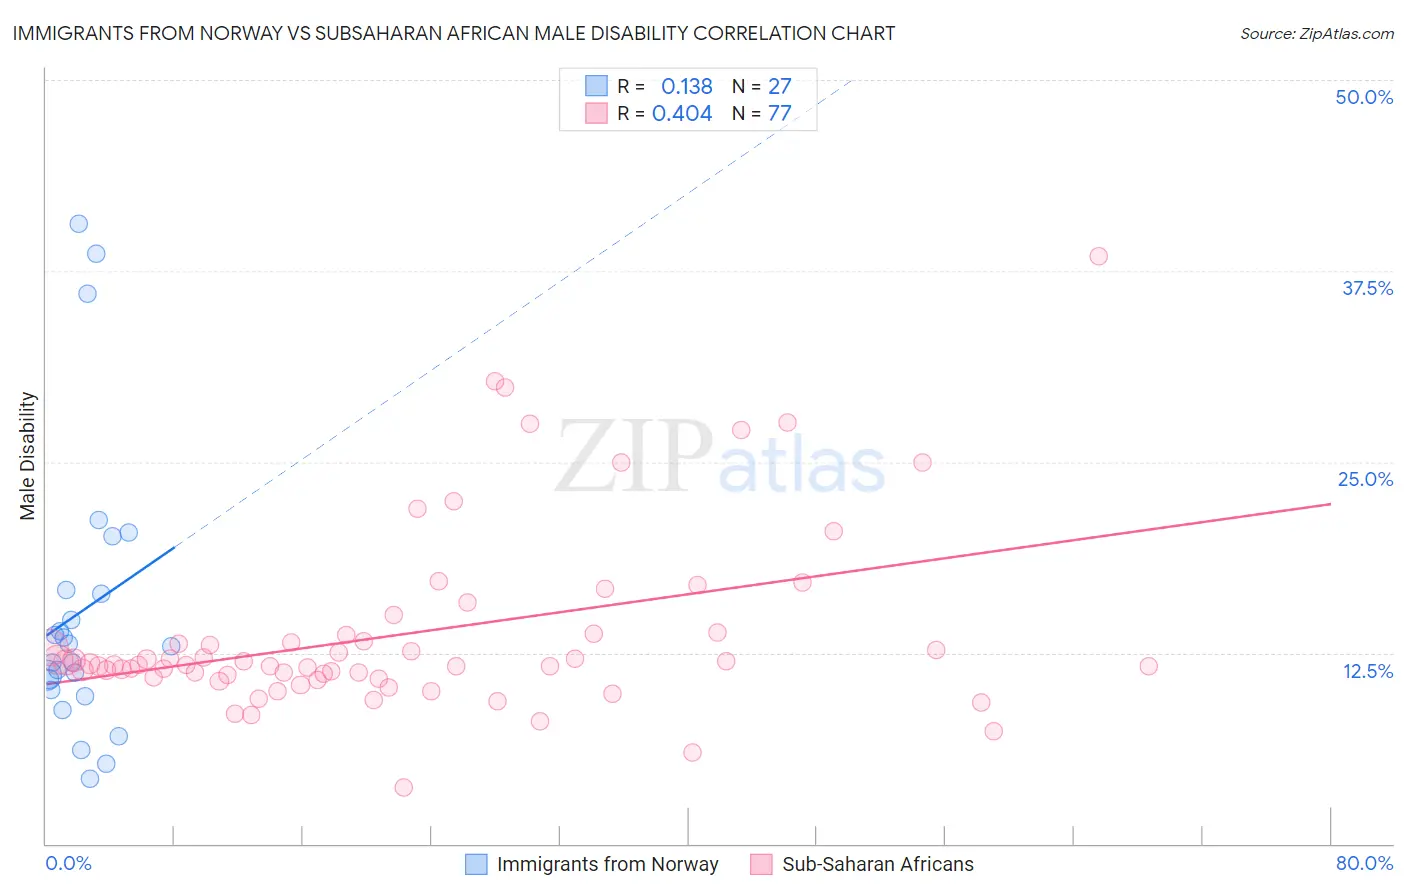
Immigrants from Norway vs Subsaharan African Male Disability Correlation Chart
The statistical analysis conducted on geographies consisting of 116,706,385 people shows a poor positive correlation between the proportion of Immigrants from Norway and percentage of males with a disability in the United States with a correlation coefficient (R) of 0.138 and weighted average of 11.3%. Similarly, the statistical analysis conducted on geographies consisting of 508,010,863 people shows a moderate positive correlation between the proportion of Sub-Saharan Africans and percentage of males with a disability in the United States with a correlation coefficient (R) of 0.404 and weighted average of 11.8%, a difference of 4.6%.
Male Disability Correlation Summary
| Measurement | Immigrants from Norway | Subsaharan African |
| Minimum | 4.3% | 3.6% |
| Maximum | 40.6% | 38.5% |
| Range | 36.4% | 34.8% |
| Mean | 15.2% | 13.8% |
| Median | 12.9% | 11.7% |
| Interquartile 25% (IQ1) | 10.1% | 11.0% |
| Interquartile 75% (IQ3) | 16.6% | 13.7% |
| Interquartile Range (IQR) | 6.6% | 2.8% |
| Standard Deviation (Sample) | 9.4% | 6.1% |
| Standard Deviation (Population) | 9.2% | 6.0% |
Similar Demographics by Male Disability
Demographics Similar to Immigrants from Norway by Male Disability
In terms of male disability, the demographic groups most similar to Immigrants from Norway are Australian (11.3%, a difference of 0.11%), Syrian (11.2%, a difference of 0.13%), Immigrants from Caribbean (11.3%, a difference of 0.15%), Honduran (11.3%, a difference of 0.17%), and Immigrants from Honduras (11.2%, a difference of 0.25%).
| Demographics | Rating | Rank | Male Disability |
| New Zealanders | 52.9 /100 | #170 | Average 11.2% |
| Haitians | 52.5 /100 | #171 | Average 11.2% |
| Romanians | 50.7 /100 | #172 | Average 11.2% |
| Immigrants | Burma/Myanmar | 50.4 /100 | #173 | Average 11.2% |
| Maltese | 50.0 /100 | #174 | Average 11.2% |
| Immigrants | Honduras | 48.7 /100 | #175 | Average 11.2% |
| Syrians | 46.6 /100 | #176 | Average 11.2% |
| Immigrants | Norway | 44.2 /100 | #177 | Average 11.3% |
| Australians | 42.2 /100 | #178 | Average 11.3% |
| Immigrants | Caribbean | 41.4 /100 | #179 | Average 11.3% |
| Hondurans | 41.1 /100 | #180 | Average 11.3% |
| Immigrants | Senegal | 34.4 /100 | #181 | Fair 11.3% |
| Immigrants | Belize | 33.7 /100 | #182 | Fair 11.3% |
| Immigrants | Central America | 32.9 /100 | #183 | Fair 11.3% |
| Iraqis | 30.5 /100 | #184 | Fair 11.3% |
Demographics Similar to Sub-Saharan Africans by Male Disability
In terms of male disability, the demographic groups most similar to Sub-Saharan Africans are Liberian (11.8%, a difference of 0.12%), Japanese (11.7%, a difference of 0.13%), Immigrants from Bahamas (11.7%, a difference of 0.15%), Austrian (11.8%, a difference of 0.18%), and Alsatian (11.7%, a difference of 0.24%).
| Demographics | Rating | Rank | Male Disability |
| Panamanians | 3.8 /100 | #219 | Tragic 11.7% |
| Immigrants | Western Europe | 3.8 /100 | #220 | Tragic 11.7% |
| Immigrants | Congo | 3.7 /100 | #221 | Tragic 11.7% |
| Alsatians | 3.3 /100 | #222 | Tragic 11.7% |
| Immigrants | Bahamas | 3.2 /100 | #223 | Tragic 11.7% |
| Japanese | 3.1 /100 | #224 | Tragic 11.7% |
| Liberians | 3.1 /100 | #225 | Tragic 11.8% |
| Sub-Saharan Africans | 2.8 /100 | #226 | Tragic 11.8% |
| Austrians | 2.5 /100 | #227 | Tragic 11.8% |
| Hispanics or Latinos | 2.3 /100 | #228 | Tragic 11.8% |
| Bermudans | 2.3 /100 | #229 | Tragic 11.8% |
| Croatians | 2.1 /100 | #230 | Tragic 11.8% |
| Dominicans | 1.8 /100 | #231 | Tragic 11.8% |
| Malaysians | 1.8 /100 | #232 | Tragic 11.8% |
| Mexicans | 1.7 /100 | #233 | Tragic 11.8% |