Immigrants from Norway vs Immigrants from Lebanon Male Disability
COMPARE
Immigrants from Norway
Immigrants from Lebanon
Male Disability
Male Disability Comparison
Immigrants from Norway
Immigrants from Lebanon
11.3%
MALE DISABILITY
44.2/ 100
METRIC RATING
177th/ 347
METRIC RANK
10.5%
MALE DISABILITY
98.8/ 100
METRIC RATING
74th/ 347
METRIC RANK
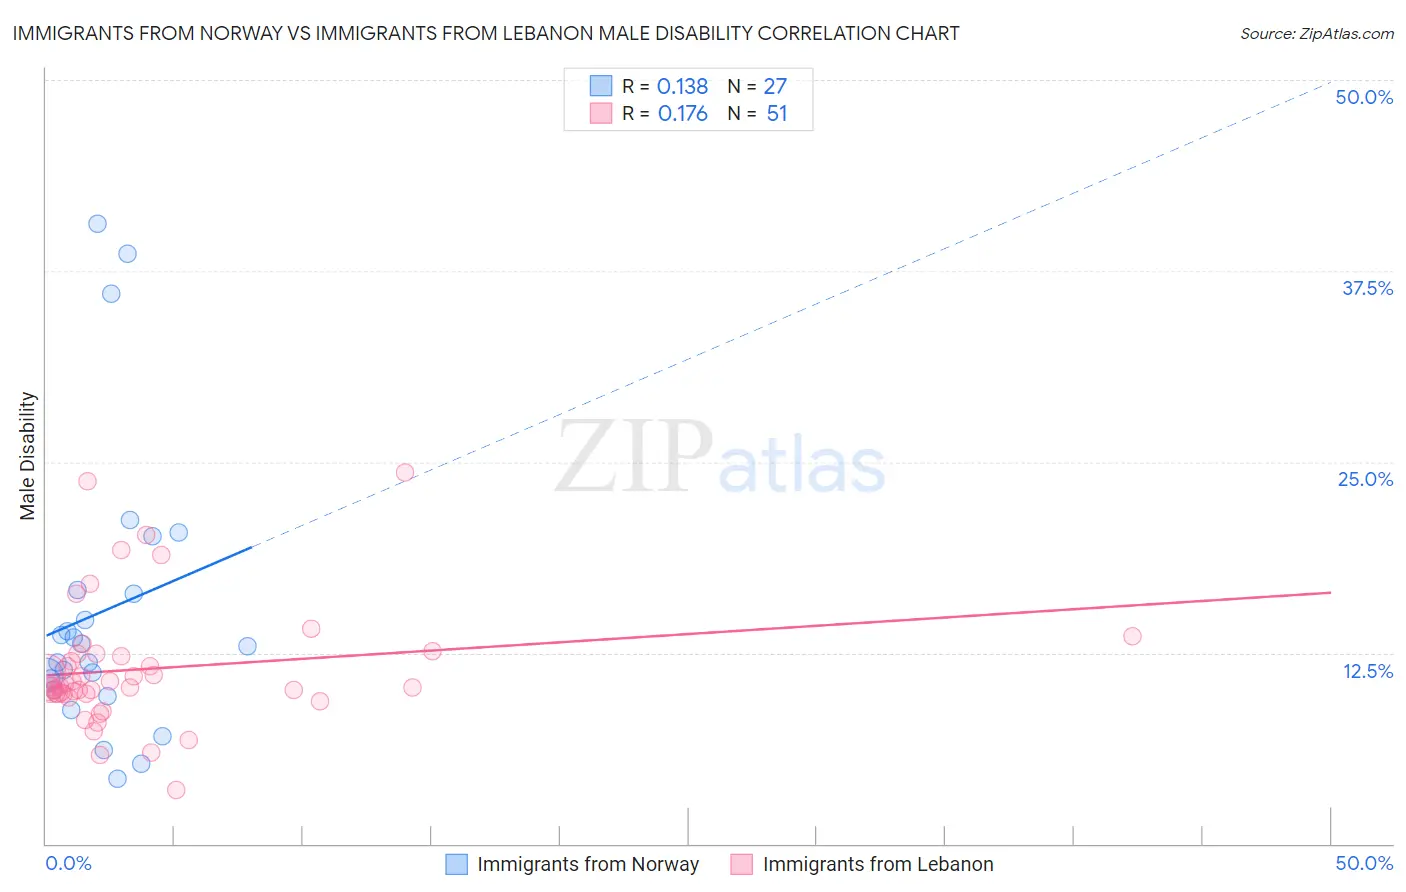
Immigrants from Norway vs Immigrants from Lebanon Male Disability Correlation Chart
The statistical analysis conducted on geographies consisting of 116,706,385 people shows a poor positive correlation between the proportion of Immigrants from Norway and percentage of males with a disability in the United States with a correlation coefficient (R) of 0.138 and weighted average of 11.3%. Similarly, the statistical analysis conducted on geographies consisting of 217,152,652 people shows a poor positive correlation between the proportion of Immigrants from Lebanon and percentage of males with a disability in the United States with a correlation coefficient (R) of 0.176 and weighted average of 10.5%, a difference of 6.9%.
Male Disability Correlation Summary
| Measurement | Immigrants from Norway | Immigrants from Lebanon |
| Minimum | 4.3% | 3.6% |
| Maximum | 40.6% | 24.3% |
| Range | 36.4% | 20.7% |
| Mean | 15.2% | 11.4% |
| Median | 12.9% | 10.3% |
| Interquartile 25% (IQ1) | 10.1% | 9.9% |
| Interquartile 75% (IQ3) | 16.6% | 12.4% |
| Interquartile Range (IQR) | 6.6% | 2.6% |
| Standard Deviation (Sample) | 9.4% | 4.1% |
| Standard Deviation (Population) | 9.2% | 4.0% |
Similar Demographics by Male Disability
Demographics Similar to Immigrants from Norway by Male Disability
In terms of male disability, the demographic groups most similar to Immigrants from Norway are Australian (11.3%, a difference of 0.11%), Syrian (11.2%, a difference of 0.13%), Immigrants from Caribbean (11.3%, a difference of 0.15%), Honduran (11.3%, a difference of 0.17%), and Immigrants from Honduras (11.2%, a difference of 0.25%).
| Demographics | Rating | Rank | Male Disability |
| New Zealanders | 52.9 /100 | #170 | Average 11.2% |
| Haitians | 52.5 /100 | #171 | Average 11.2% |
| Romanians | 50.7 /100 | #172 | Average 11.2% |
| Immigrants | Burma/Myanmar | 50.4 /100 | #173 | Average 11.2% |
| Maltese | 50.0 /100 | #174 | Average 11.2% |
| Immigrants | Honduras | 48.7 /100 | #175 | Average 11.2% |
| Syrians | 46.6 /100 | #176 | Average 11.2% |
| Immigrants | Norway | 44.2 /100 | #177 | Average 11.3% |
| Australians | 42.2 /100 | #178 | Average 11.3% |
| Immigrants | Caribbean | 41.4 /100 | #179 | Average 11.3% |
| Hondurans | 41.1 /100 | #180 | Average 11.3% |
| Immigrants | Senegal | 34.4 /100 | #181 | Fair 11.3% |
| Immigrants | Belize | 33.7 /100 | #182 | Fair 11.3% |
| Immigrants | Central America | 32.9 /100 | #183 | Fair 11.3% |
| Iraqis | 30.5 /100 | #184 | Fair 11.3% |
Demographics Similar to Immigrants from Lebanon by Male Disability
In terms of male disability, the demographic groups most similar to Immigrants from Lebanon are Sierra Leonean (10.5%, a difference of 0.12%), Immigrants from Lithuania (10.5%, a difference of 0.14%), Immigrants from Sierra Leone (10.5%, a difference of 0.16%), Immigrants from Serbia (10.5%, a difference of 0.21%), and Laotian (10.6%, a difference of 0.21%).
| Demographics | Rating | Rank | Male Disability |
| Immigrants | Afghanistan | 99.2 /100 | #67 | Exceptional 10.5% |
| Colombians | 99.2 /100 | #68 | Exceptional 10.5% |
| Ecuadorians | 99.2 /100 | #69 | Exceptional 10.5% |
| Immigrants | Bulgaria | 99.1 /100 | #70 | Exceptional 10.5% |
| Immigrants | Cameroon | 99.0 /100 | #71 | Exceptional 10.5% |
| Immigrants | Serbia | 99.0 /100 | #72 | Exceptional 10.5% |
| Immigrants | Lithuania | 98.9 /100 | #73 | Exceptional 10.5% |
| Immigrants | Lebanon | 98.8 /100 | #74 | Exceptional 10.5% |
| Sierra Leoneans | 98.7 /100 | #75 | Exceptional 10.5% |
| Immigrants | Sierra Leone | 98.7 /100 | #76 | Exceptional 10.5% |
| Laotians | 98.6 /100 | #77 | Exceptional 10.6% |
| Immigrants | Russia | 98.6 /100 | #78 | Exceptional 10.6% |
| Zimbabweans | 98.4 /100 | #79 | Exceptional 10.6% |
| Immigrants | Jordan | 98.4 /100 | #80 | Exceptional 10.6% |
| Immigrants | Chile | 98.3 /100 | #81 | Exceptional 10.6% |