Immigrants from Norway vs Immigrants from Haiti Male Disability
COMPARE
Immigrants from Norway
Immigrants from Haiti
Male Disability
Male Disability Comparison
Immigrants from Norway
Immigrants from Haiti
11.3%
MALE DISABILITY
44.2/ 100
METRIC RATING
177th/ 347
METRIC RANK
11.1%
MALE DISABILITY
65.3/ 100
METRIC RATING
162nd/ 347
METRIC RANK
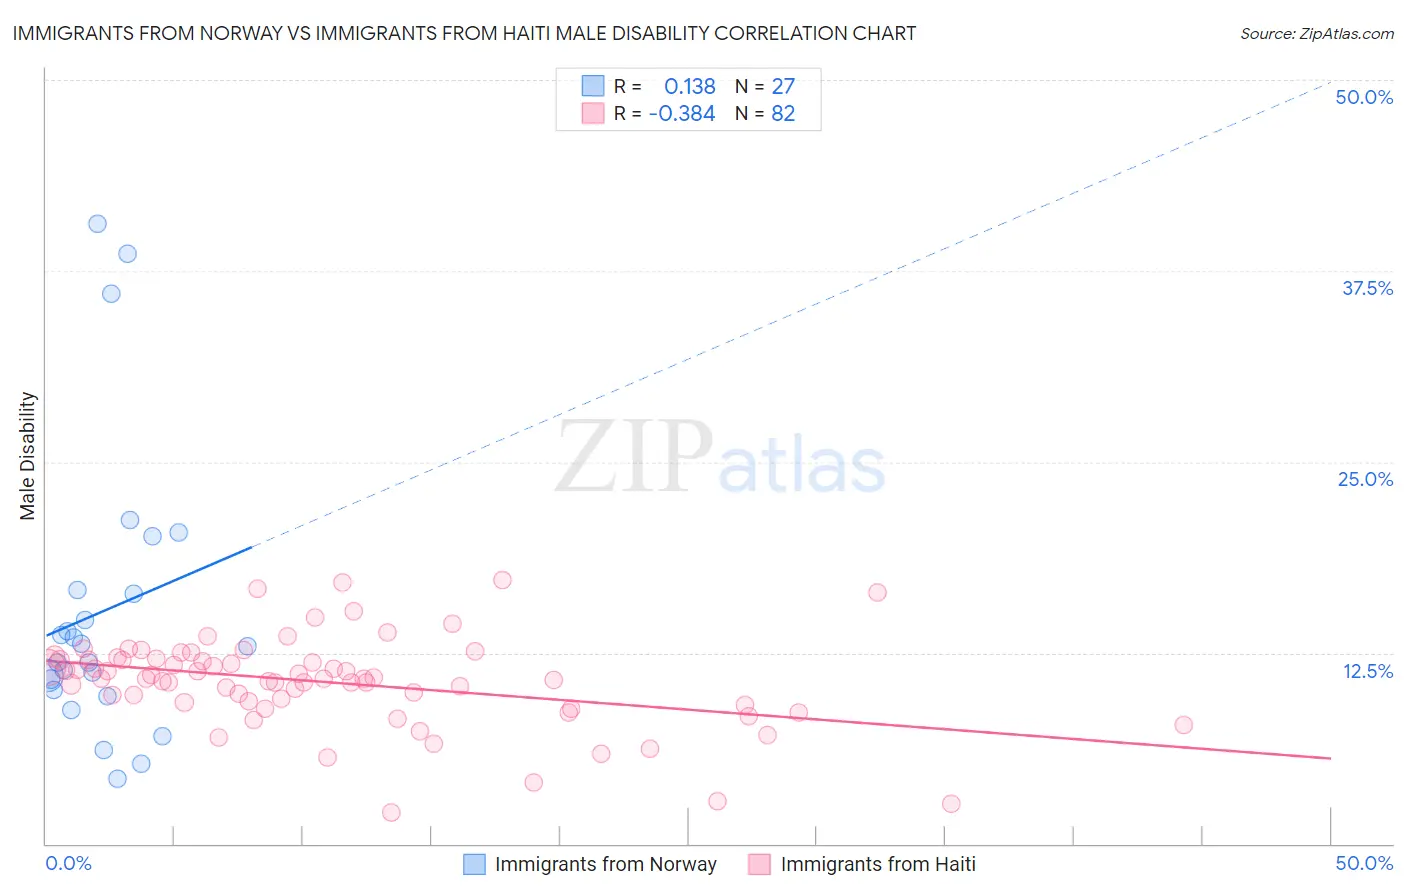
Immigrants from Norway vs Immigrants from Haiti Male Disability Correlation Chart
The statistical analysis conducted on geographies consisting of 116,706,385 people shows a poor positive correlation between the proportion of Immigrants from Norway and percentage of males with a disability in the United States with a correlation coefficient (R) of 0.138 and weighted average of 11.3%. Similarly, the statistical analysis conducted on geographies consisting of 225,231,442 people shows a mild negative correlation between the proportion of Immigrants from Haiti and percentage of males with a disability in the United States with a correlation coefficient (R) of -0.384 and weighted average of 11.1%, a difference of 1.2%.
Male Disability Correlation Summary
| Measurement | Immigrants from Norway | Immigrants from Haiti |
| Minimum | 4.3% | 2.1% |
| Maximum | 40.6% | 17.2% |
| Range | 36.4% | 15.1% |
| Mean | 15.2% | 10.6% |
| Median | 12.9% | 10.8% |
| Interquartile 25% (IQ1) | 10.1% | 9.2% |
| Interquartile 75% (IQ3) | 16.6% | 12.1% |
| Interquartile Range (IQR) | 6.6% | 2.8% |
| Standard Deviation (Sample) | 9.4% | 2.9% |
| Standard Deviation (Population) | 9.2% | 2.9% |
Demographics Similar to Immigrants from Norway and Immigrants from Haiti by Male Disability
In terms of male disability, the demographic groups most similar to Immigrants from Norway are Australian (11.3%, a difference of 0.11%), Syrian (11.2%, a difference of 0.13%), Immigrants from Caribbean (11.3%, a difference of 0.15%), Immigrants from Honduras (11.2%, a difference of 0.25%), and Maltese (11.2%, a difference of 0.33%). Similarly, the demographic groups most similar to Immigrants from Haiti are Immigrants from West Indies (11.1%, a difference of 0.020%), Albanian (11.1%, a difference of 0.070%), Immigrants from Kenya (11.1%, a difference of 0.090%), Guatemalan (11.1%, a difference of 0.12%), and British West Indian (11.1%, a difference of 0.15%).
| Demographics | Rating | Rank | Male Disability |
| Guatemalans | 67.2 /100 | #159 | Good 11.1% |
| Albanians | 66.5 /100 | #160 | Good 11.1% |
| Immigrants | West Indies | 65.7 /100 | #161 | Good 11.1% |
| Immigrants | Haiti | 65.3 /100 | #162 | Good 11.1% |
| Immigrants | Kenya | 63.8 /100 | #163 | Good 11.1% |
| British West Indians | 62.8 /100 | #164 | Good 11.1% |
| Luxembourgers | 61.9 /100 | #165 | Good 11.1% |
| Immigrants | Hungary | 61.2 /100 | #166 | Good 11.1% |
| Immigrants | Southern Europe | 54.4 /100 | #167 | Average 11.2% |
| Immigrants | Latin America | 54.0 /100 | #168 | Average 11.2% |
| Barbadians | 53.4 /100 | #169 | Average 11.2% |
| New Zealanders | 52.9 /100 | #170 | Average 11.2% |
| Haitians | 52.5 /100 | #171 | Average 11.2% |
| Romanians | 50.7 /100 | #172 | Average 11.2% |
| Immigrants | Burma/Myanmar | 50.4 /100 | #173 | Average 11.2% |
| Maltese | 50.0 /100 | #174 | Average 11.2% |
| Immigrants | Honduras | 48.7 /100 | #175 | Average 11.2% |
| Syrians | 46.6 /100 | #176 | Average 11.2% |
| Immigrants | Norway | 44.2 /100 | #177 | Average 11.3% |
| Australians | 42.2 /100 | #178 | Average 11.3% |
| Immigrants | Caribbean | 41.4 /100 | #179 | Average 11.3% |