Immigrants from Burma/Myanmar vs Subsaharan African Male Disability
COMPARE
Immigrants from Burma/Myanmar
Subsaharan African
Male Disability
Male Disability Comparison
Immigrants from Burma/Myanmar
Sub-Saharan Africans
11.2%
MALE DISABILITY
50.4/ 100
METRIC RATING
173rd/ 347
METRIC RANK
11.8%
MALE DISABILITY
2.8/ 100
METRIC RATING
226th/ 347
METRIC RANK
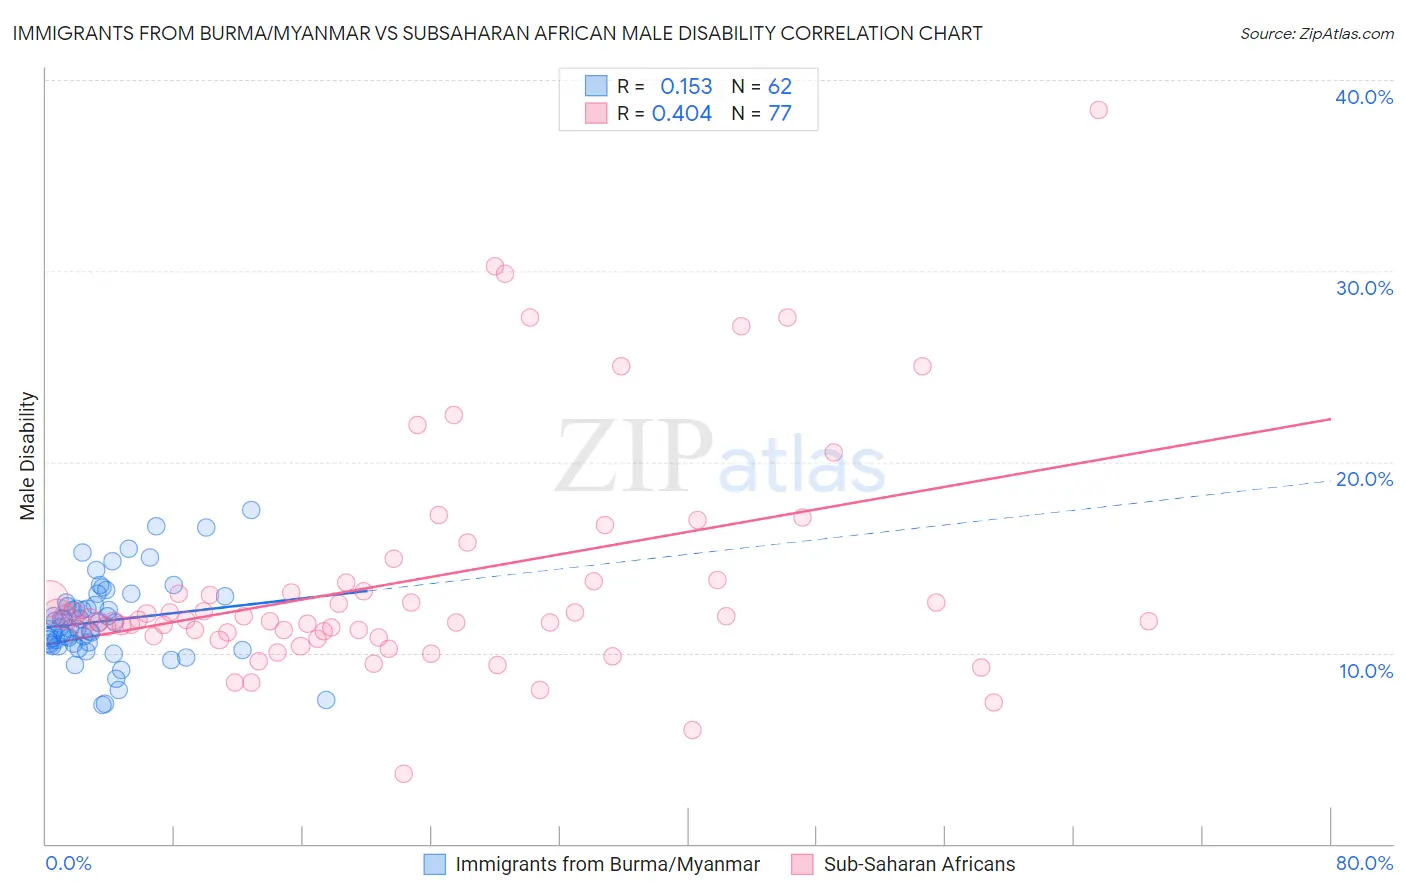
Immigrants from Burma/Myanmar vs Subsaharan African Male Disability Correlation Chart
The statistical analysis conducted on geographies consisting of 172,332,425 people shows a poor positive correlation between the proportion of Immigrants from Burma/Myanmar and percentage of males with a disability in the United States with a correlation coefficient (R) of 0.153 and weighted average of 11.2%. Similarly, the statistical analysis conducted on geographies consisting of 508,010,863 people shows a moderate positive correlation between the proportion of Sub-Saharan Africans and percentage of males with a disability in the United States with a correlation coefficient (R) of 0.404 and weighted average of 11.8%, a difference of 4.9%.
Male Disability Correlation Summary
| Measurement | Immigrants from Burma/Myanmar | Subsaharan African |
| Minimum | 7.3% | 3.6% |
| Maximum | 17.5% | 38.5% |
| Range | 10.2% | 34.8% |
| Mean | 11.7% | 13.8% |
| Median | 11.4% | 11.7% |
| Interquartile 25% (IQ1) | 10.5% | 11.0% |
| Interquartile 75% (IQ3) | 12.6% | 13.7% |
| Interquartile Range (IQR) | 2.1% | 2.8% |
| Standard Deviation (Sample) | 2.2% | 6.1% |
| Standard Deviation (Population) | 2.1% | 6.0% |
Similar Demographics by Male Disability
Demographics Similar to Immigrants from Burma/Myanmar by Male Disability
In terms of male disability, the demographic groups most similar to Immigrants from Burma/Myanmar are Romanian (11.2%, a difference of 0.020%), Maltese (11.2%, a difference of 0.020%), Immigrants from Honduras (11.2%, a difference of 0.10%), Haitian (11.2%, a difference of 0.12%), and New Zealander (11.2%, a difference of 0.14%).
| Demographics | Rating | Rank | Male Disability |
| Immigrants | Hungary | 61.2 /100 | #166 | Good 11.1% |
| Immigrants | Southern Europe | 54.4 /100 | #167 | Average 11.2% |
| Immigrants | Latin America | 54.0 /100 | #168 | Average 11.2% |
| Barbadians | 53.4 /100 | #169 | Average 11.2% |
| New Zealanders | 52.9 /100 | #170 | Average 11.2% |
| Haitians | 52.5 /100 | #171 | Average 11.2% |
| Romanians | 50.7 /100 | #172 | Average 11.2% |
| Immigrants | Burma/Myanmar | 50.4 /100 | #173 | Average 11.2% |
| Maltese | 50.0 /100 | #174 | Average 11.2% |
| Immigrants | Honduras | 48.7 /100 | #175 | Average 11.2% |
| Syrians | 46.6 /100 | #176 | Average 11.2% |
| Immigrants | Norway | 44.2 /100 | #177 | Average 11.3% |
| Australians | 42.2 /100 | #178 | Average 11.3% |
| Immigrants | Caribbean | 41.4 /100 | #179 | Average 11.3% |
| Hondurans | 41.1 /100 | #180 | Average 11.3% |
Demographics Similar to Sub-Saharan Africans by Male Disability
In terms of male disability, the demographic groups most similar to Sub-Saharan Africans are Liberian (11.8%, a difference of 0.12%), Japanese (11.7%, a difference of 0.13%), Immigrants from Bahamas (11.7%, a difference of 0.15%), Austrian (11.8%, a difference of 0.18%), and Alsatian (11.7%, a difference of 0.24%).
| Demographics | Rating | Rank | Male Disability |
| Panamanians | 3.8 /100 | #219 | Tragic 11.7% |
| Immigrants | Western Europe | 3.8 /100 | #220 | Tragic 11.7% |
| Immigrants | Congo | 3.7 /100 | #221 | Tragic 11.7% |
| Alsatians | 3.3 /100 | #222 | Tragic 11.7% |
| Immigrants | Bahamas | 3.2 /100 | #223 | Tragic 11.7% |
| Japanese | 3.1 /100 | #224 | Tragic 11.7% |
| Liberians | 3.1 /100 | #225 | Tragic 11.8% |
| Sub-Saharan Africans | 2.8 /100 | #226 | Tragic 11.8% |
| Austrians | 2.5 /100 | #227 | Tragic 11.8% |
| Hispanics or Latinos | 2.3 /100 | #228 | Tragic 11.8% |
| Bermudans | 2.3 /100 | #229 | Tragic 11.8% |
| Croatians | 2.1 /100 | #230 | Tragic 11.8% |
| Dominicans | 1.8 /100 | #231 | Tragic 11.8% |
| Malaysians | 1.8 /100 | #232 | Tragic 11.8% |
| Mexicans | 1.7 /100 | #233 | Tragic 11.8% |