Israeli vs Subsaharan African Male Disability
COMPARE
Israeli
Subsaharan African
Male Disability
Male Disability Comparison
Israelis
Sub-Saharan Africans
10.3%
MALE DISABILITY
99.7/ 100
METRIC RATING
48th/ 347
METRIC RANK
11.8%
MALE DISABILITY
2.8/ 100
METRIC RATING
226th/ 347
METRIC RANK
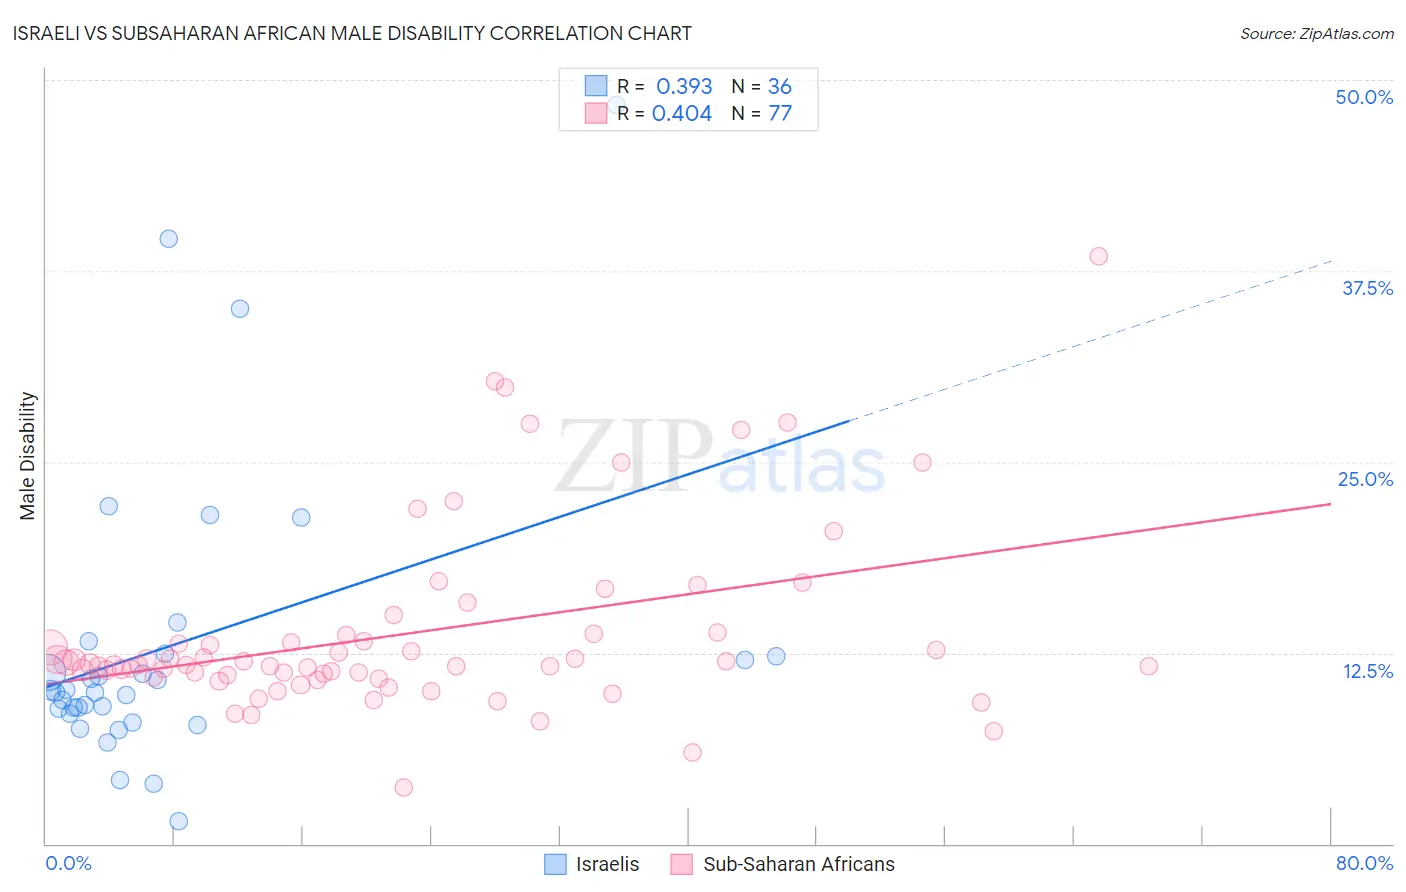
Israeli vs Subsaharan African Male Disability Correlation Chart
The statistical analysis conducted on geographies consisting of 211,170,801 people shows a mild positive correlation between the proportion of Israelis and percentage of males with a disability in the United States with a correlation coefficient (R) of 0.393 and weighted average of 10.3%. Similarly, the statistical analysis conducted on geographies consisting of 508,010,863 people shows a moderate positive correlation between the proportion of Sub-Saharan Africans and percentage of males with a disability in the United States with a correlation coefficient (R) of 0.404 and weighted average of 11.8%, a difference of 14.0%.
Male Disability Correlation Summary
| Measurement | Israeli | Subsaharan African |
| Minimum | 1.5% | 3.6% |
| Maximum | 48.4% | 38.5% |
| Range | 46.9% | 34.8% |
| Mean | 13.0% | 13.8% |
| Median | 10.0% | 11.7% |
| Interquartile 25% (IQ1) | 8.7% | 11.0% |
| Interquartile 75% (IQ3) | 12.4% | 13.7% |
| Interquartile Range (IQR) | 3.7% | 2.8% |
| Standard Deviation (Sample) | 9.7% | 6.1% |
| Standard Deviation (Population) | 9.6% | 6.0% |
Similar Demographics by Male Disability
Demographics Similar to Israelis by Male Disability
In terms of male disability, the demographic groups most similar to Israelis are Immigrants from Peru (10.3%, a difference of 0.030%), Immigrants from Spain (10.3%, a difference of 0.060%), Cambodian (10.3%, a difference of 0.070%), Immigrants from El Salvador (10.3%, a difference of 0.15%), and Turkish (10.3%, a difference of 0.15%).
| Demographics | Rating | Rank | Male Disability |
| Taiwanese | 99.8 /100 | #41 | Exceptional 10.3% |
| Mongolians | 99.7 /100 | #42 | Exceptional 10.3% |
| Immigrants | Bangladesh | 99.7 /100 | #43 | Exceptional 10.3% |
| Immigrants | El Salvador | 99.7 /100 | #44 | Exceptional 10.3% |
| Turks | 99.7 /100 | #45 | Exceptional 10.3% |
| Cambodians | 99.7 /100 | #46 | Exceptional 10.3% |
| Immigrants | Peru | 99.7 /100 | #47 | Exceptional 10.3% |
| Israelis | 99.7 /100 | #48 | Exceptional 10.3% |
| Immigrants | Spain | 99.7 /100 | #49 | Exceptional 10.3% |
| South Americans | 99.6 /100 | #50 | Exceptional 10.3% |
| Salvadorans | 99.6 /100 | #51 | Exceptional 10.4% |
| Immigrants | Saudi Arabia | 99.6 /100 | #52 | Exceptional 10.4% |
| Immigrants | Uzbekistan | 99.6 /100 | #53 | Exceptional 10.4% |
| Peruvians | 99.6 /100 | #54 | Exceptional 10.4% |
| Immigrants | Eritrea | 99.6 /100 | #55 | Exceptional 10.4% |
Demographics Similar to Sub-Saharan Africans by Male Disability
In terms of male disability, the demographic groups most similar to Sub-Saharan Africans are Liberian (11.8%, a difference of 0.12%), Japanese (11.7%, a difference of 0.13%), Immigrants from Bahamas (11.7%, a difference of 0.15%), Austrian (11.8%, a difference of 0.18%), and Alsatian (11.7%, a difference of 0.24%).
| Demographics | Rating | Rank | Male Disability |
| Panamanians | 3.8 /100 | #219 | Tragic 11.7% |
| Immigrants | Western Europe | 3.8 /100 | #220 | Tragic 11.7% |
| Immigrants | Congo | 3.7 /100 | #221 | Tragic 11.7% |
| Alsatians | 3.3 /100 | #222 | Tragic 11.7% |
| Immigrants | Bahamas | 3.2 /100 | #223 | Tragic 11.7% |
| Japanese | 3.1 /100 | #224 | Tragic 11.7% |
| Liberians | 3.1 /100 | #225 | Tragic 11.8% |
| Sub-Saharan Africans | 2.8 /100 | #226 | Tragic 11.8% |
| Austrians | 2.5 /100 | #227 | Tragic 11.8% |
| Hispanics or Latinos | 2.3 /100 | #228 | Tragic 11.8% |
| Bermudans | 2.3 /100 | #229 | Tragic 11.8% |
| Croatians | 2.1 /100 | #230 | Tragic 11.8% |
| Dominicans | 1.8 /100 | #231 | Tragic 11.8% |
| Malaysians | 1.8 /100 | #232 | Tragic 11.8% |
| Mexicans | 1.7 /100 | #233 | Tragic 11.8% |